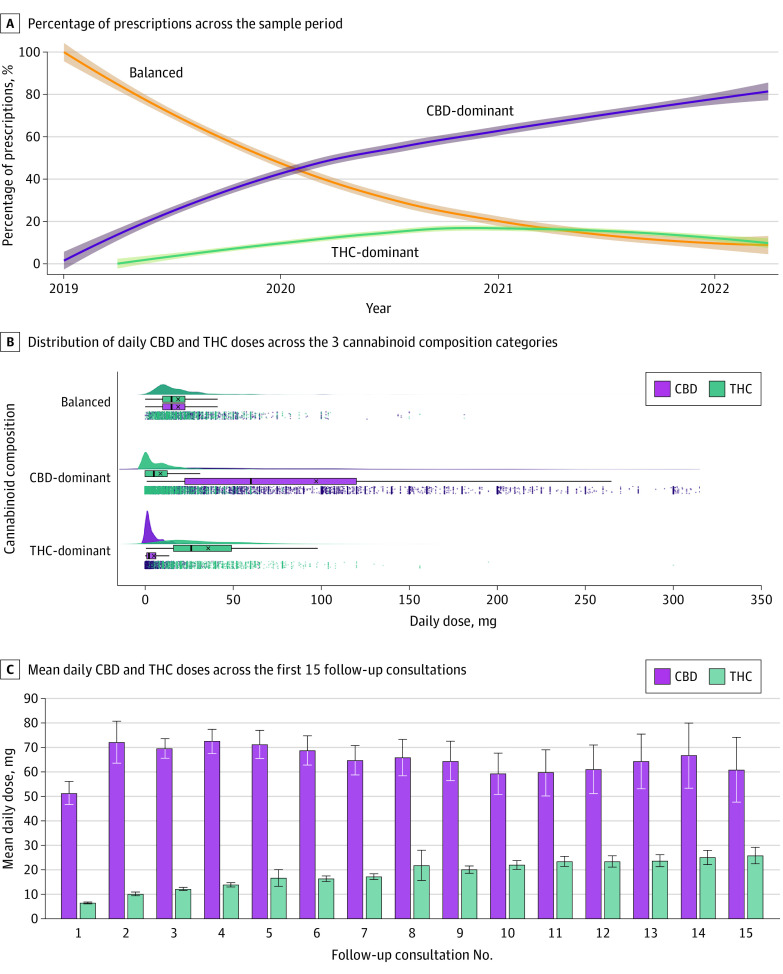
Figure 1. Treatment Characteristics Over Time.
A, The y-axis corresponds to the cannabinoid composition of medical cannabis prescriptions (balanced, CBD-dominant, THC-dominant). The x-axis represents time in years over the sample period (December 2018 to May 2022). The solid fitted lines are locally estimated scatterplot smoothing curves with bandwidths of 0.9 and 2-sided 95% CIs around the smooths. B, Raincloud plots for the daily dose amounts of CBD and THC (x-axis) across the 3 main cannabinoid composition categories (y-axis) are shown. Each dot in the panel corresponds to a single patient-consult dose recording (measured in mg), whereas the boxplot showcases the associated means (denoted by the x), medians (middle line of the box), first and third quartiles (left and right hinges), and 1.5 times the interquartile range left and right of the first and third quartiles, respectively (left and right whiskers), for both CBD and THC. Finally, the split-violin plot visualizes the distribution density of CBD/THC dosing behavior. C, The y-axis represents the daily dose of CBD and THC taken, while the x-axis denotes the number of consultations since commencing treatment. Error bars show 95% CI. CBD indicates cannabidiol; THC, delta-9-tetrahydrocannabinol.

