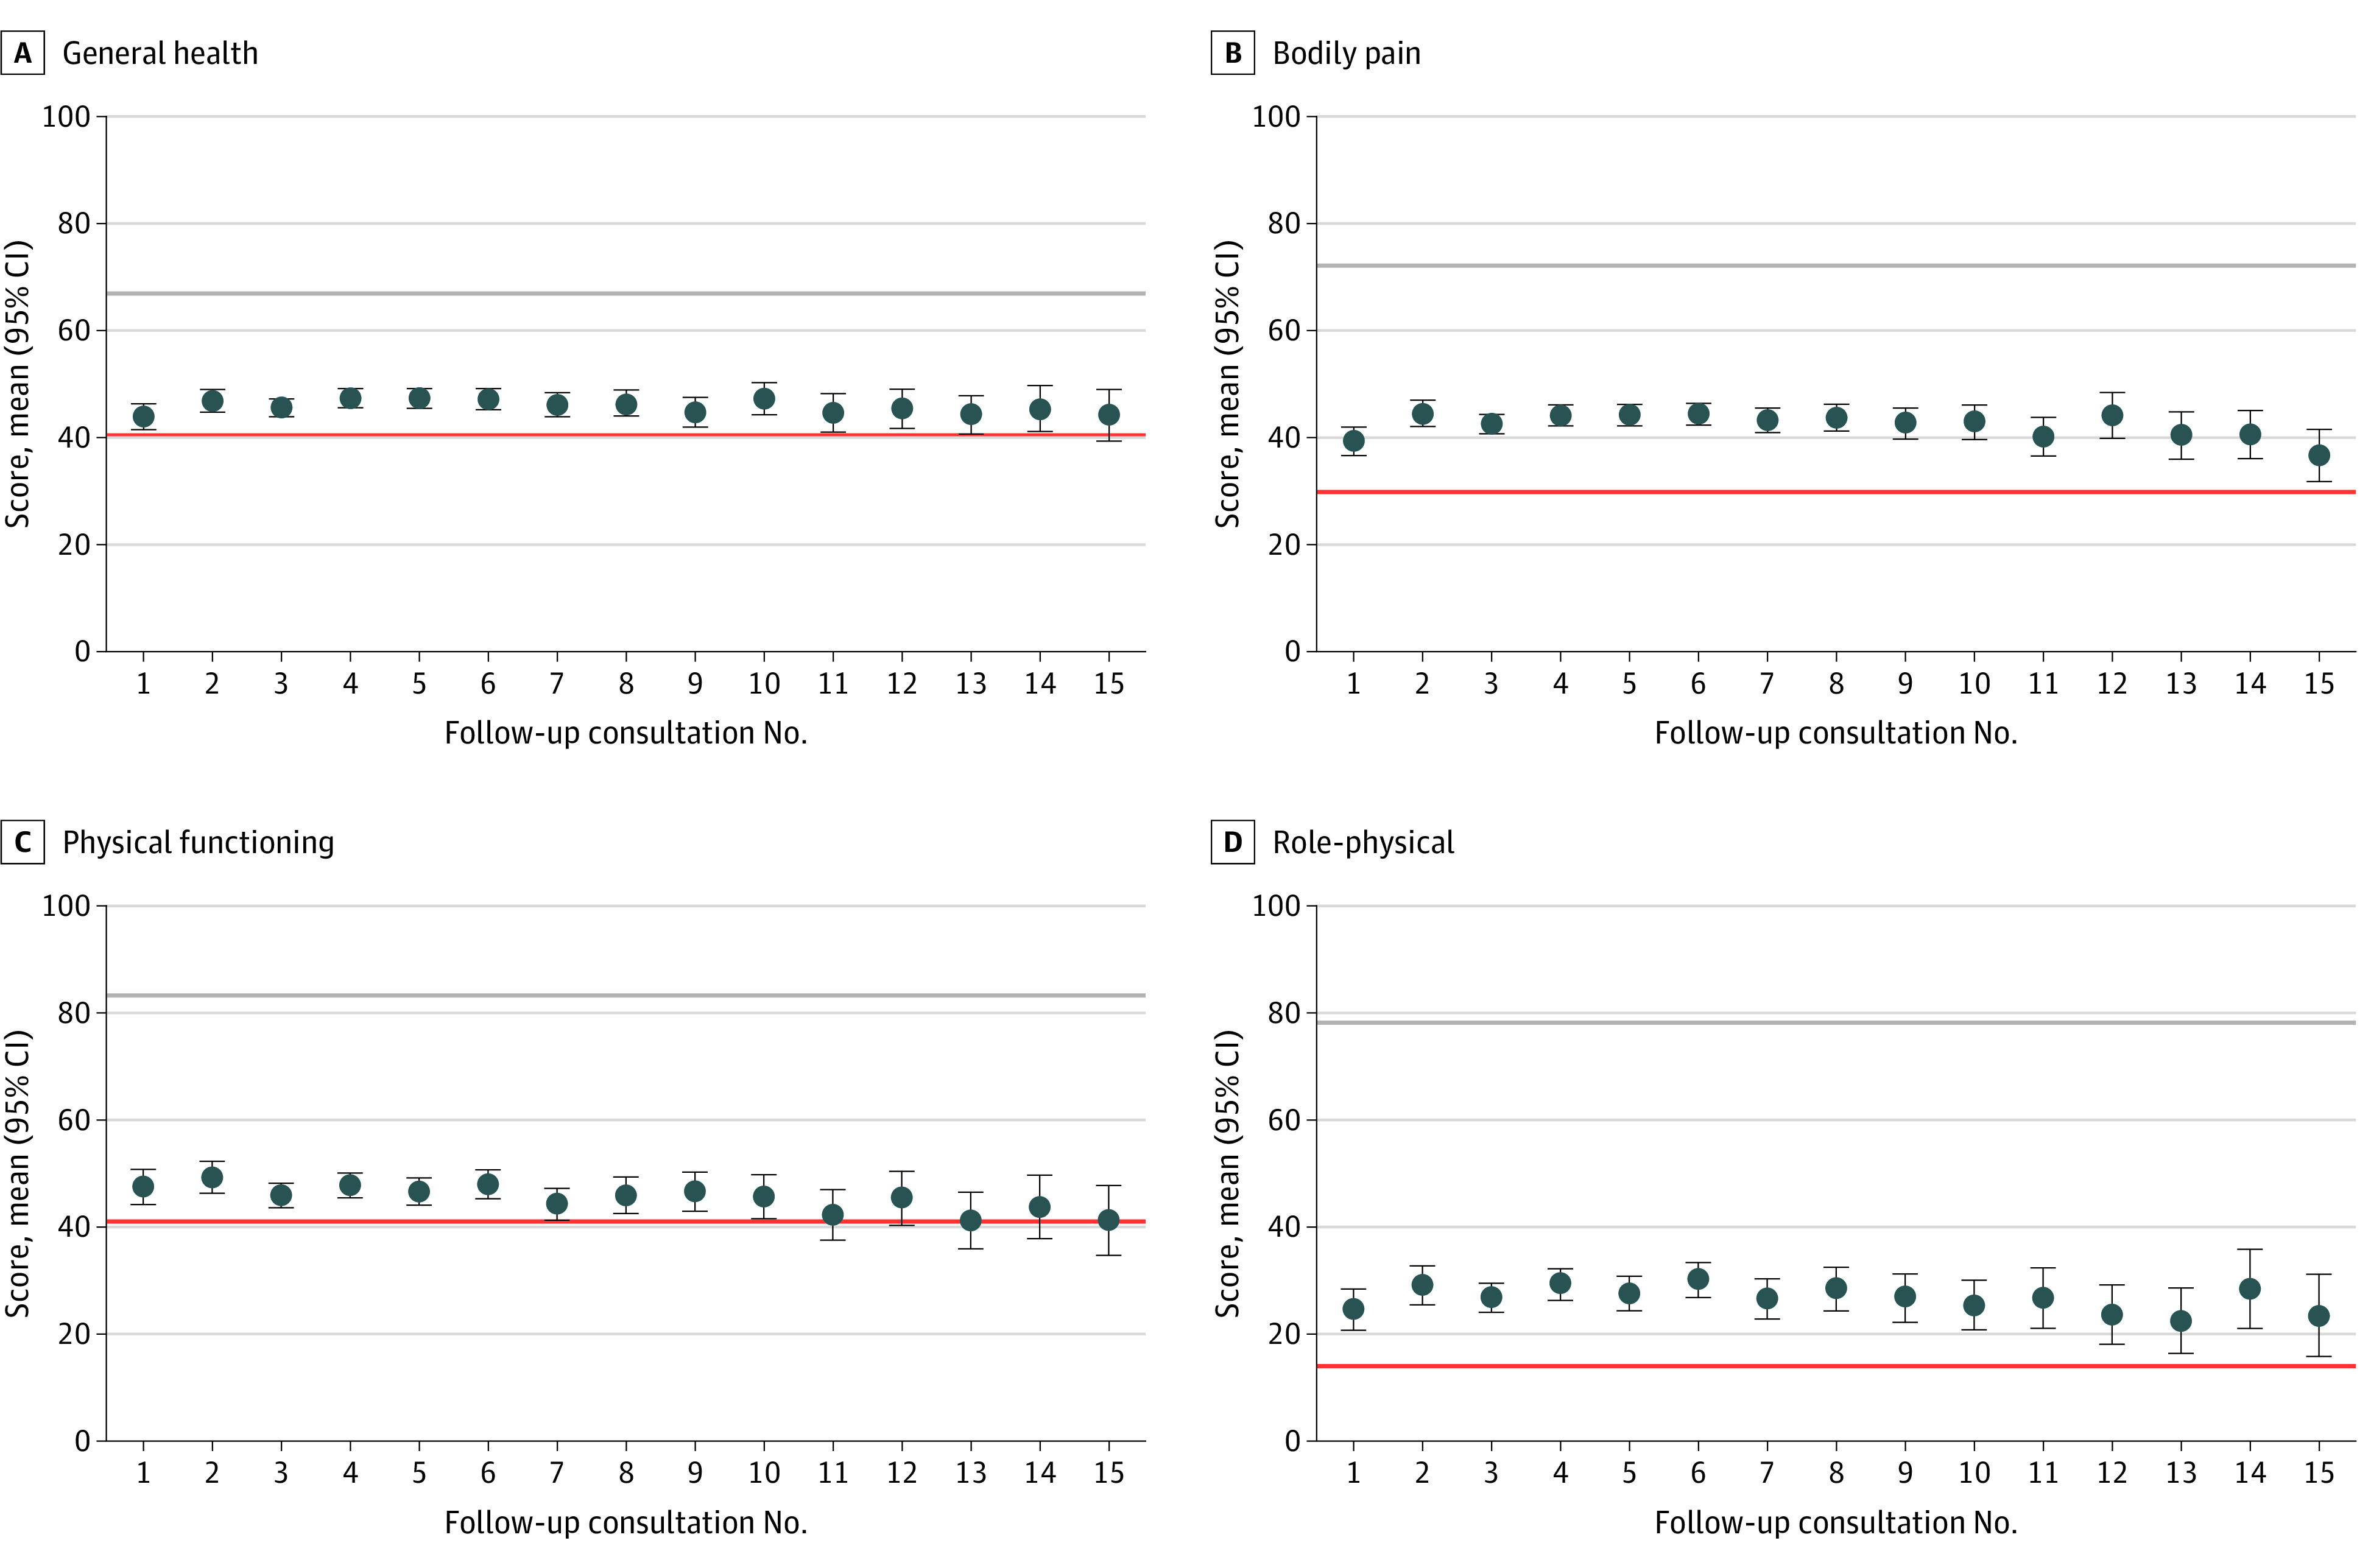
Figure 2. Mean 36-Item Short Form Health Survey (SF-36) Scores for General Health, Bodily Pain, Physical Functioning, and Role-Physical .

Mean scores on the y-axes correspond to the respective 0 to 100 subscales for general health (A), bodily pain (B), physical functioning (C), and role-physical (D) from the SF-36, respectively. The follow-up on the x-axes represents the number of consultations since commencing treatment. Mean levels of the 4 domain scores are computed for each follow-up consult. The red horizontal lines show the respective pretreatment means at baseline. The gray horizontal lines illustrate the associated means reported by individuals in the 2015 wave of the Household, Income and Labour Dynamics in Australia survey (see reference in text). Error bars show 95% CIs.
