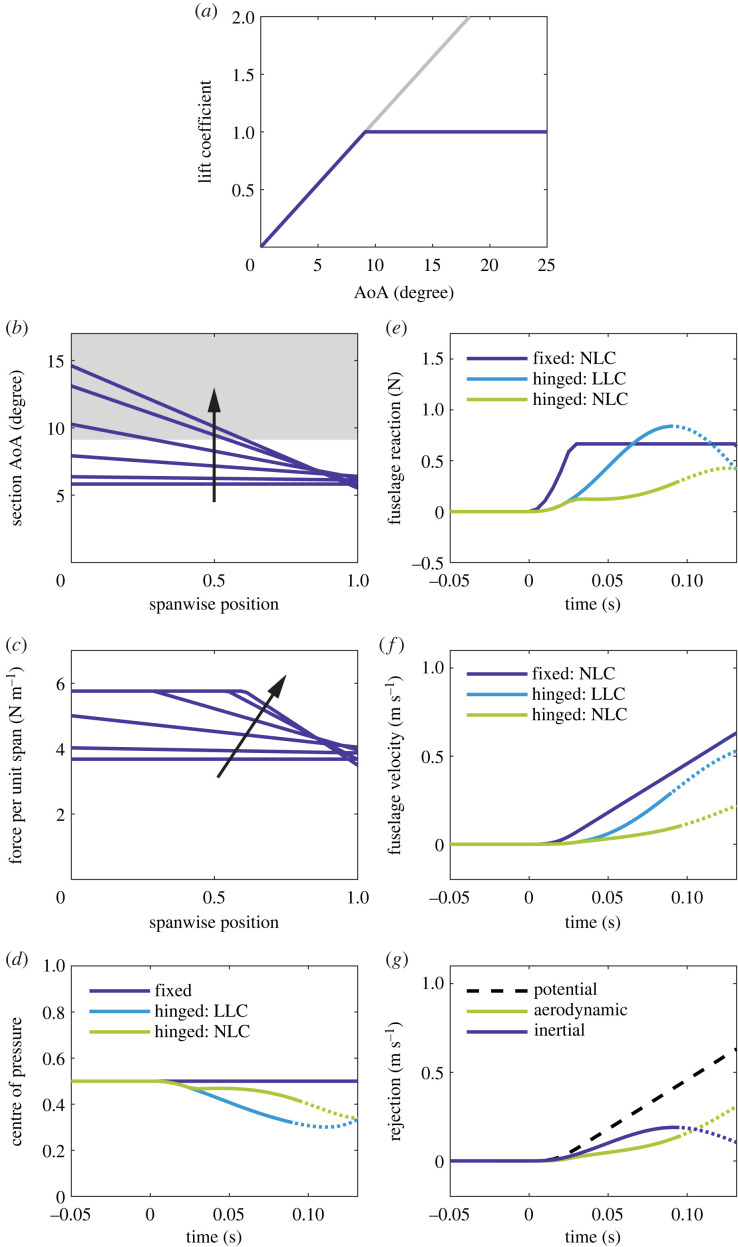
Figure 4.
Gust response of the hinged and fixed systems with an LLC/NLC in the 30% gust. Plot lines become dotted at the instant the wing angle crosses 20 degrees (the approximate onset of nonlinearity). (a) The NLC lift coefficient is capped at unity at the stall AoA. (b) Spanwise AoA distributions at six evenly spaced instants in time during the first half of the linear period, from gust onset (t = 0 ms) to approximate maximum force saturation (t ≃ 0.05 ms), for the NLC hinged system. The arrow identifies forward chronology as the AoA enters the stall region (shaded grey). Note that the spanwise position has been normalized. (c) Spanwise force distributions at the same six instants in time for the NLC hinged system. The arrow identifies forward chronology as the initial force distribution flattens out. Note that the spanwise position has been normalized. (d) Normalized centre of pressure lF/l. (e) Dynamic fuselage reaction ΔR. The departure from the LLC line coincides with the onset of force saturation. (f) Resulting fuselage velocity . (g) Rejection terms for the NLC hinged system. The potential line indicates the maximum achievable rejection (that is necessary to keep the fuselage on a perfectly level trajectory).

