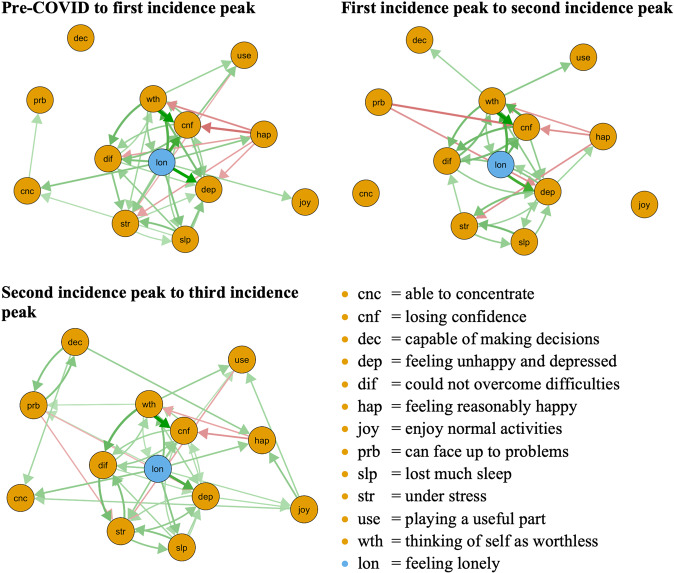
Fig. 1. The cross-lagged panel networks for pre to incidence peak and incidence peak to incidence peak time-points.
The relationship of the symptoms is indicated by the arrow’s color (green = positive, red = negative), the strength of the relationship is indicated by the arrow’s thickness (thicker = stronger). In these networks, autoregressive effects are excluded. Threshold was set to 0.05, excluding all relationships < 0.05. Final N = 17,761.

