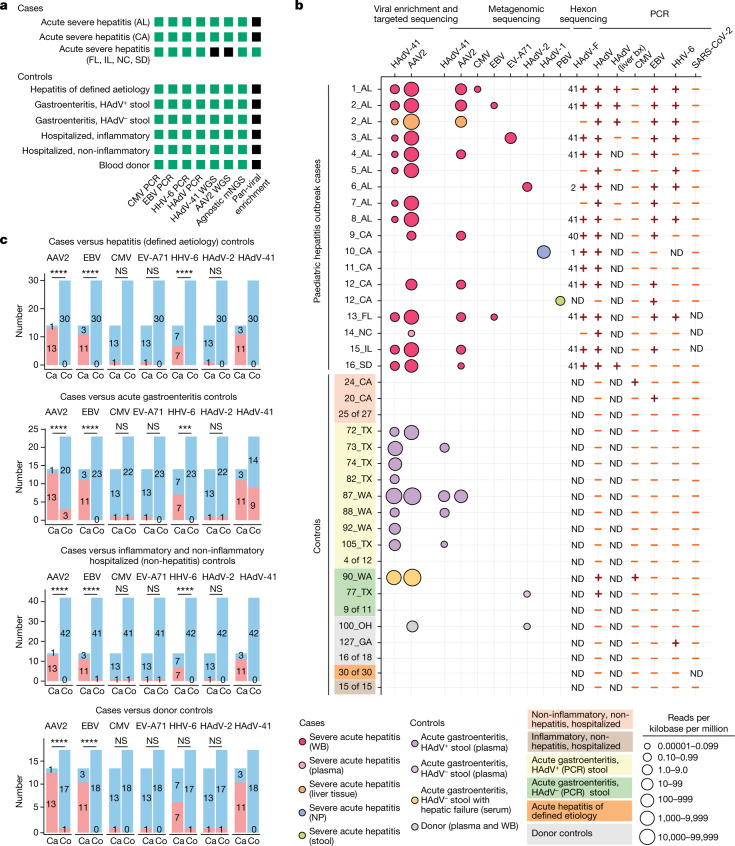
Fig. 2. Sequencing and molecular-based testing for viruses carried out on cases and controls.
a, Analyses carried out on the different sample groups. The specific assays carried out for each group are shown in green whereas assays that were not carried out are shaded in black. WGS, whole-genome sequencing. mNGS, metagenomic next-generation sequencing. b, Graphical chart showing results of sequencing or PCR-based assays for virus detection. Each circle represents a sequenced sample with at least three non-overlapping reads29 aligning to a viral reference sequence. Circles are colour-coded on the basis of sample type and scaled according to normalized viral read counts. Viral PCR positive and negative results are denoted by plus and minus symbols, respectively. For the HAdV-F PCR, the HAdV subtype identified by hexon sequencing is shown to the left of the viral PCR result. PBV, picobirnavirus; bx, biopsy; ND, not determined. c, Associations between viruses detected in blood and cases of acute severe hepatitis of unknown aetiology in children. Red and blue shading indicate positive and negative detection, respectively. Uncorrected P values were calculated using two-tailed Fisher’s exact test. A Bonferroni-corrected significance level of P < 0.002 was considered significant (n = 24 comparisons). Exact P values are provided in Supplementary Table 2. Ca, cases; Co, controls; AL, Alabama; CA, California; FL, Florida; GA, Georgia; IL, Illinois; NC, North Carolina; OH, Ohio; SD, South Dakota; TX, Texas; WA, Washington; NS, not significant; ***P < 0.001; ****P < 0.0001.

