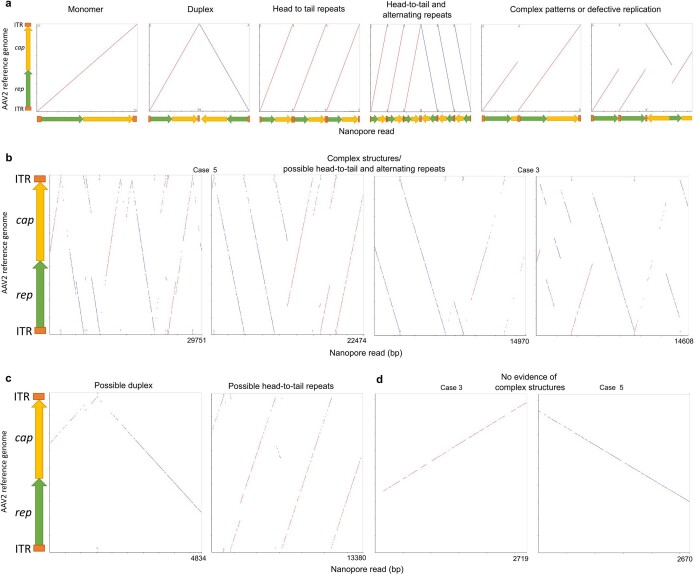
Extended Data Fig. 2. Examples of AAV2 complexes.
The y axis shows the coordinates of a full length AAV2 genome (rep gene in green and cap gene in yellow). X axis is the nanopore read with the length of the read indicated. Red dots indicate alignment to the forward strand and blue dots the reverse. a, indicative complexes based on literature8 b and c. Examples of complex structures with both head to tail and alternating repeats, from a total of n = 25 and n = 75 such reads for cases 3 and 5 respectively. b shows the longest 2 reads for each case. d. Examples of truncated monomeric structures, from a total of n = 27 and n = 103 such reads for cases 3 and 5 respectively (Supplementary Table 3). The longest such read for each case is shown.

