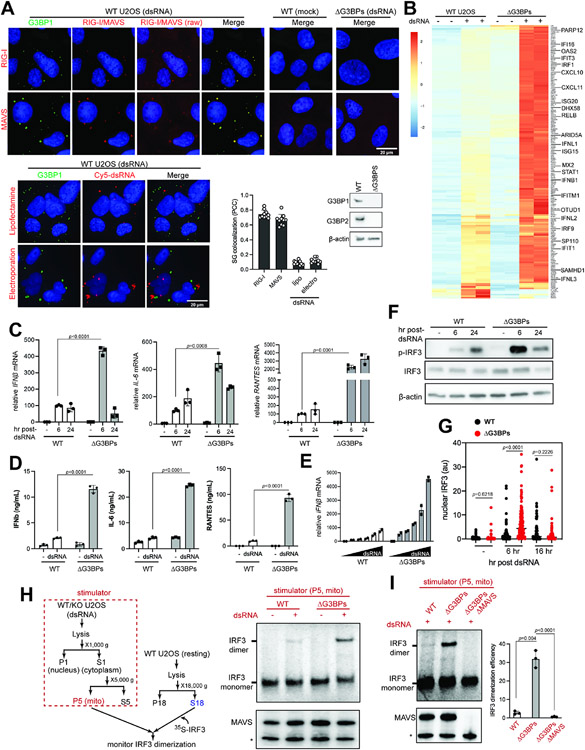
Figure 1. RLR signaling is hyperactive in SG-deficient ΔG3BPs cells.
A. Immunofluorescence (IF) analysis of RIG-I, MAVS and dsRNA (red) with G3BP1 (green) in U2OS cells. See Figure S1A for antibody validation. Cells were transfected with 162 bp dsRNA containing 5’ppp (500 ng/ml) for 6 hrs prior to imaging. Raw images for RIG-I and MAVS without contrast adjustment (raw) were also shown. For dsRNA imaging, 162 bp dsRNA 3’-labeled with Cy5 was introduced into cells by lipofectamine transfection or electroporation. Unless mentioned otherwise, unlabeled dsRNA and lipofectamine transfection was used throughout the manuscript. Cell nuclei were stained with Hoechst 3342. Bottom right: SG colocalization was measured by Pearson colocalization coefficient (PCC) between G3BP1 foci and indicated molecules from 10 fields of view.
B. Heatmap of z-scores displaying differentially expressed genes in WT vs ΔG3BPs U2OS cells. Cells were transfected with 162 bp dsRNA with 5’ppp (500 ng/ml) for 6 hrs. Genes showing log2-fold change (lfc2) >2 (with p_adj<0.05) upon dsRNA stimulation in a MAVS-dependent manner (based on the analysis in Figure S2B) were shown. All genes were shown in Figure S2A.
C. Levels of IFNβ, IL-6, and RANTES mRNAs. U2OS cells were transfected with dsRNA as in (B) and were analyzed 6 or 24 hr post-dsRNA. Data were normalized to WT 6 hr post-dsRNA.
D. Levels of secreted IFNβ, IL-6, and RANTES as measured by ELISA. U2OS cells were transfected with dsRNA as in (B) and were analyzed at 6 hr post-dsRNA.
E. Level of IFNβ mRNAs in response to the increasing concentrations of dsRNA (50-2000 ng/ml) at 6 hr post-dsRNA. Data were normalized to WT 50 ng/ml.
F. Activation state of IRF3, as measured by its phosphorylation level in U2OS cells.
G. Activation state of IRF3, as measured by its nuclear translocation. U2OS cells were stained with anti-IRF3 antibody at indicated timepoints and the level of nuclear IRF3 signal was quantitated (a.u. indicates arbitrary unit). Each data point represents a nucleus (n=61-179). DAPI staining was used for defining nuclear boundary.
H. Activation state of MAVS, as measured by cell-free IRF3 dimerization assay. Mitochondrial fraction (P5) containing MAVS was isolated from U2OS cells 6 hrs post-dsRNA, and mixed with a common pool of cytosolic extract (S18) from unstimulated WT U2OS cells and in vitro translated 35S-IRF3. Dimerization of 35S-IRF3 was analyzed by native gel assay. * indicates mini-MAVS.
I. Cell-free IRF3 dimerization assay, comparing the activity of the mitochondrial fraction isolated from WT, ΔG3BPs and ΔG3BPs/ΔMAVS U2OS cells.
Data are presented in means ± SD. p values were calculated using two-tailed unpaired Student’s t test (ns, p>0.05). RNA-seq results contain 2 biological repeats and were confirmed by two independent experiments. All other data are representative of at least three independent experiments.). Raw data for the heatmap can be found in the supplemental file (data 1).

