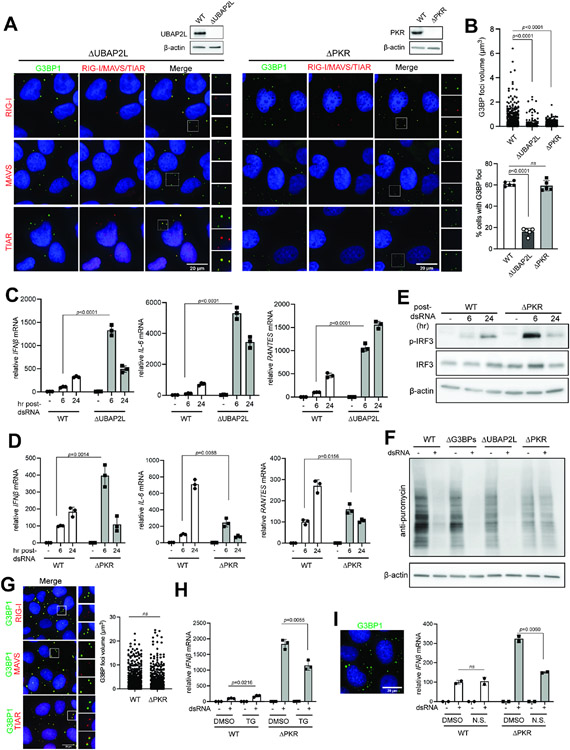
Figure 2. SG deficiency leads to hyperactivation of RLR signaling.
A. Immunofluorescence analysis of RIG-I, MAVS, TIAR (red) and G3BP1 (green) in ΔUBAP2L and ΔPKR U2OS cells at 6 hrs post-dsRNA.
B. G3BP1 foci size and frequency in ΔUBAP2L and ΔPKR U2OS cells. Foci size was quantitated for at least 200 randomly selected granules from Z-stack images (0.15 μm step size). Foci frequency was measured from 5 fields of view.
C. Antiviral signaling in U2OS cells (WT vs ΔUBAP2L) in response to dsRNA transfection (500 ng/ml). Data were normalized to WT 6 hr post-dsRNA.
D. Same as (C), comparing WT and ΔPKR U2OS cells.
E. IRF3 phosphorylation in U2OS cells (WT vs ΔPKR) upon dsRNA stimulation.
F. Level of protein synthesis as measured by puromycin incorporation (SUnSET assay72). U2OS cells were transfected with dsRNA (500 ng/ml) for 6 hrs and pulsed with puromycin (1 μg/ml) for 15 mins prior to anti-puromycin WB.
G. Colocalization of RIG-I, MAVS and TIAR (red) with G3BP1 (green) in U2OSΔPKR cells upon treatment with TG (1 μM) without dsRNA. G3BP1 foci size was quantitated for at least 600 randomly selected granules from Z-stack images (0.15 μm step size).
H. Antiviral signaling in U2OS cells (WT vs ΔPKR) in response to dsRNA, in the presence and absence of TG. Cells were treated with TG (1 μM) at 1 hr post-dsRNA and harvested 6 hr post-dsRNA. Data were normalized to WT in the absence of TG.
I. Antiviral signaling in U2OS cells (WT vs ΔPKR) in response to dsRNA, with or without nutrient starvation (N.S.). Cells were incubated with a starvation medium for 2 hrs prior to dsRNA transfection and were harvested 6 hr post-dsRNA. Data were normalized to WT in the absence of nutrient starvation. Left: SGs in ΔPKR cells upon nutrient starvation for 8 hrs as visualized by G3BP1 foci.
Data are presented in means ± SD. p values were calculated using two-tailed unpaired Student’s t test (ns, p>0.05). Data are representative of three independent experiments.

