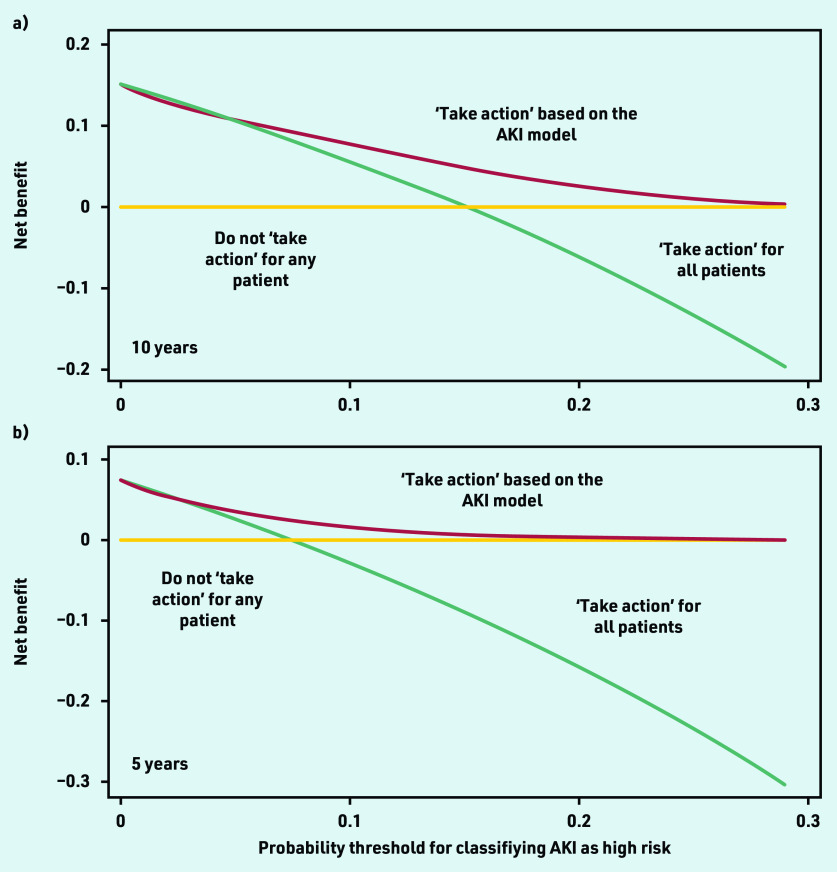
Figure 2.
Decision curve analysis, showing net benefit of using the AKI prediction model for determining which patients are at high risk of AKI at: a) 10 years; and b) 5 years. The y-axis corresponds to the unit of measurement of net benefit (true positives; a net benefit of 0.1 means 10 true positives per 100 patients). The x-axis corresponds to a potential threshold probability from the AKI model (for example, a 10% threshold used to define patients at high risk for developing AKI). All plots have lines corresponding to the net benefit of ‘taking action’ to address the high AKI risk (either through monitoring, or deprescribing of antihypertensive drugs). Treat all corresponds to ‘taking action’ for all patients irrespective of AKI risk. Treat none corresponds to not ‘taking action’ for anyone. The line that is the highest corresponds to the best strategy at any given threshold probability. AKI = acute kidney injury.

