Fig. 6.
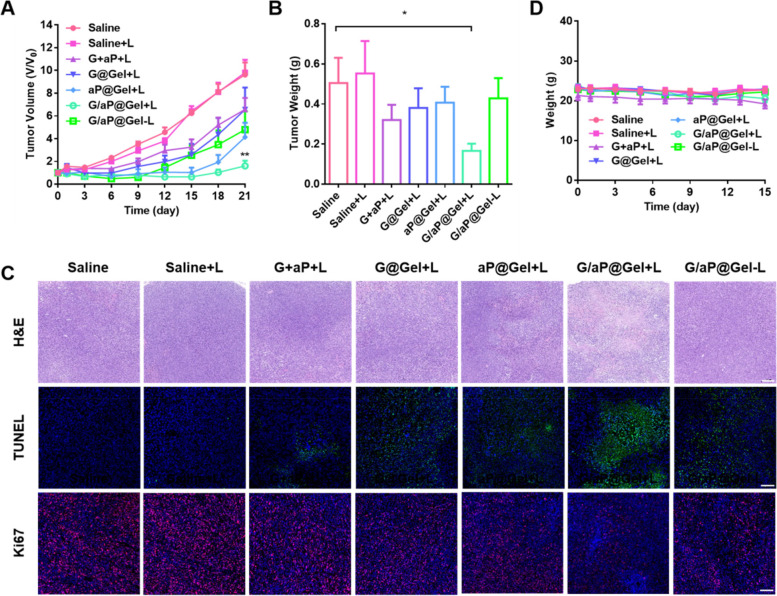
In vivo anti-tumor effects of hydrogel. A Growth curves of 4T1 tumor-bearing mice model after various treatments. Data presented as mean ± SEM (n = 7). B The weight of tumors obtained from the tumor-bearing mice after different treatments. C Immunofluorescence staining of H&E and TUNEL in tumors from each group on day 3 after treatment. (H&E, Scale bar = 200 µm, TUNEL, Scale bar = 100 µm, Ki67, Scale bar = 100 µm.). (D) Body weight changes of the mice during the therapy. The comparison of two groups was followed by unpaired Student’s t-test (two-tailed). The level of significance was defined as *p < 0.05, **p < 0.01

