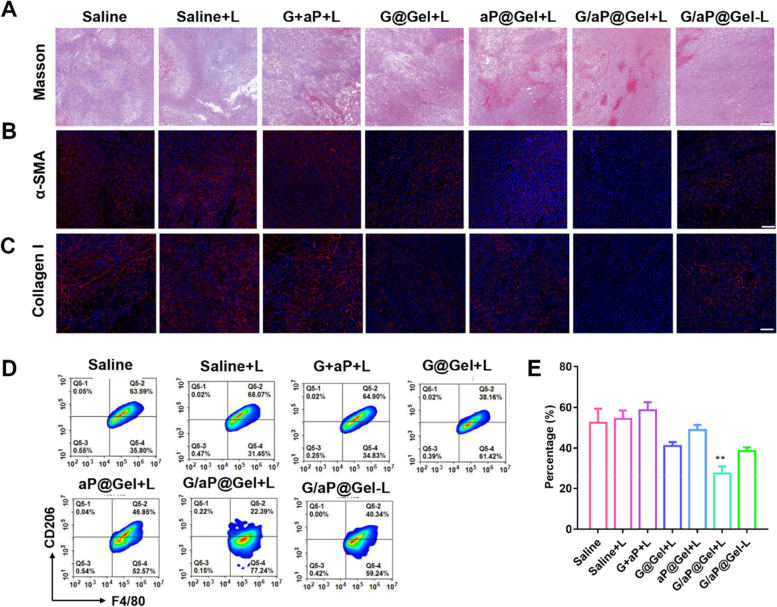
Fig. 7.
Reduction of M2-type macrophages in tumor through the treatment of hydrogel by interfering with CAFs. A Masson’s trichrome staining of collagen, (Scale bar = 200 µm) (B) immunofluorescence staining of α-SMA (Scale bar = 100 µm) and (C) collagen I (Scale bar = 100 µm) in tumors after various treatments. D Representative flow cytometry plots showing percentages of M2-type macrophages in tumors on day 5 after treatments. E The percentages of M2-type macrophages in tumors upon various treatments. Data presented as mean ± SD (n = 5). The comparison of two groups was followed by unpaired Student’s t-test (two-tailed). The level of significance was defined as *p < 0.05, **p < 0.01

