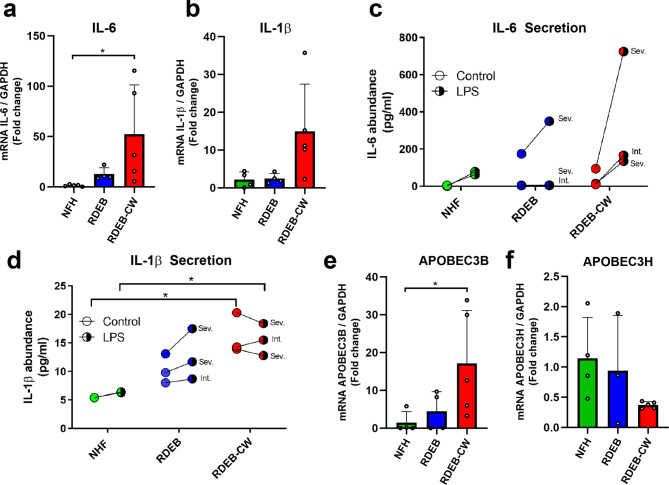
Fig. 5.
Expression of inflammatory cytokines and cancer-related proteins in RDEB-CW fibroblasts. (a-b) Reverse Transcription (RT) qPCR analysis of inflammatory cytokines IL-1β and IL-6. Asterisks indicate significant differences by one-way ANOVA with Tukey post-hoc (p < 0.05, n = 4–5). (c-d) Cytokine analysis in supernatants of fibroblast cultures by flow cytometry, using the CBA cytokine kit for detecting IL-1β (c) and IL-6 (d). Disease severity is indicated for RDEB-derived patient samples (n = 2–3). Asterisks indicate significant differences by Kruskal-Wallis with Dunn’s multiple comparisons test (p < 0.05). (e-f) RT-qPCR analysis of two cancer-related genes APOBEC3B (e) and APOBEC3H (f). Asterisks indicate significant differences by one-way ANOVA with Tukey post-hoc (p < 0.05, n = 4–5). All data are expressed as mean ± SD, except for data shown in Figures (c) and (d)

