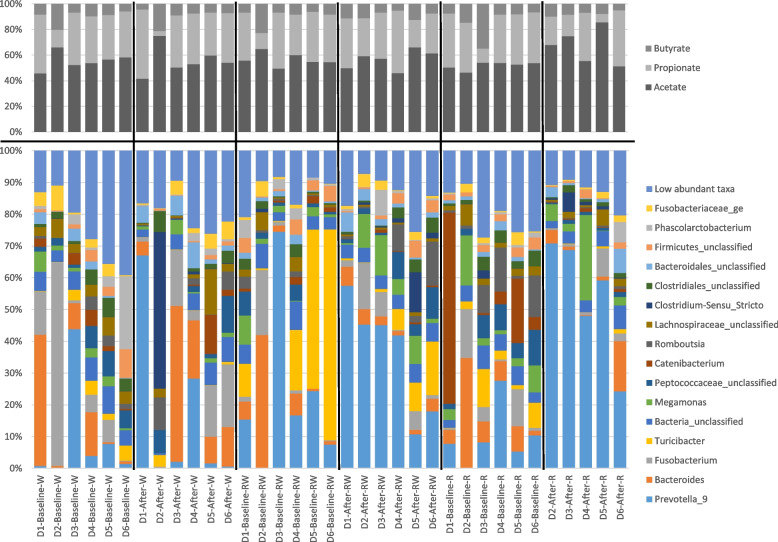
Fig. 3.
Barcharts showing relative proportions of short chain fatty acids (upper barchart) and microbiota (lower barchart) for individual samples. D1-D6 in sample legends represent the individual dogs whereas “baseline” and “after” indicate if it was before or after the diet period. For easier interpretation, only taxa with an average relative abundance > 2% are shown in the figure. All taxa with lower average relative abundance are shown as low abundant taxa. W = wheat diet, RW = diet with equal mixture of whole grain rye and refined wheat, R = whole grain rye diet

