Fig. 8.
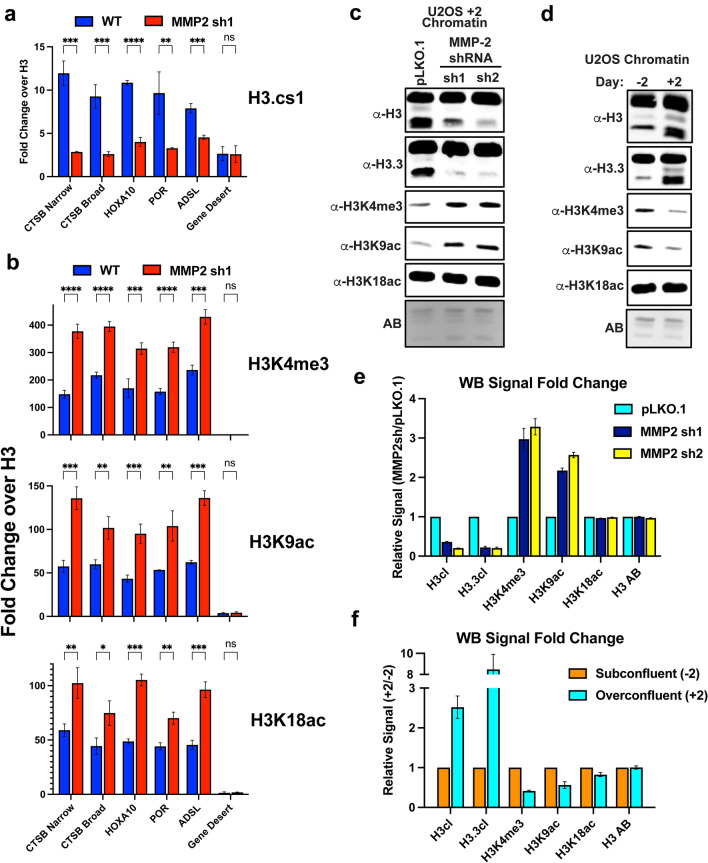
MMP-2 mediated H3NT proteolysis alters the histone code at TSSs a ChIP was performed in U2OS wild type (WT, blue) and MMP-2 depleted cells (MMP2sh1, red) using the H3.cs1 antibody, that detects cleaved H3NT, and a C-terminal H3 antibody to normalize for nucleosome occupancy. qPCR was performed at the indicated ProMMP2-3xHA positive gene loci and a negative control locus (gene desert, x-axis). Enrichment of cleaved H3NT at each locus was plotted as fold change relative to H3 control (y-axis), with the average and standard deviation between three independent biological replicates shown. Statistically significant differences between WT and MMP2sh1 at each locus were determined by a Student T-test (p-value: ns > 0.05, * < 0.05, ** < 0.005, *** < 0.0005, **** < 0.00005). b ChIP-qPCR analysis of histone H3 lysine 4 trimethyl (H3K4me3, top), lysine 9 acetyl (H3K9ac, middle) and lysine 18 acetyl (H3K18ac, bottom) as described in a. c Western analysis of chromatin purified from U2OS pLKO.1 control cells and the 2 different U2OS pLKO.1-MMP2 shRNA cell lines (sh1 and sh2) using the indicated antibodies. Amido black stain (AB) of the membrane shows equivalent loading of chromatin between samples. d Western analysis of chromatin purified from U2OS subconfluent (− 2) and overconfluent (+ 2) cells, as described in c. e Quantitative analysis of band intensities from c for each antibody (x-axis) was performed using ImageStudio (BioRad) and plotted as fold change relative to the pLKO.1 control, with the average and standard deviation of three independent biological replicates shown. f Quantitative analysis of band intensities from d, as described in e, plotted as fold change relative to U2OS subconfluent cells (− 2)

