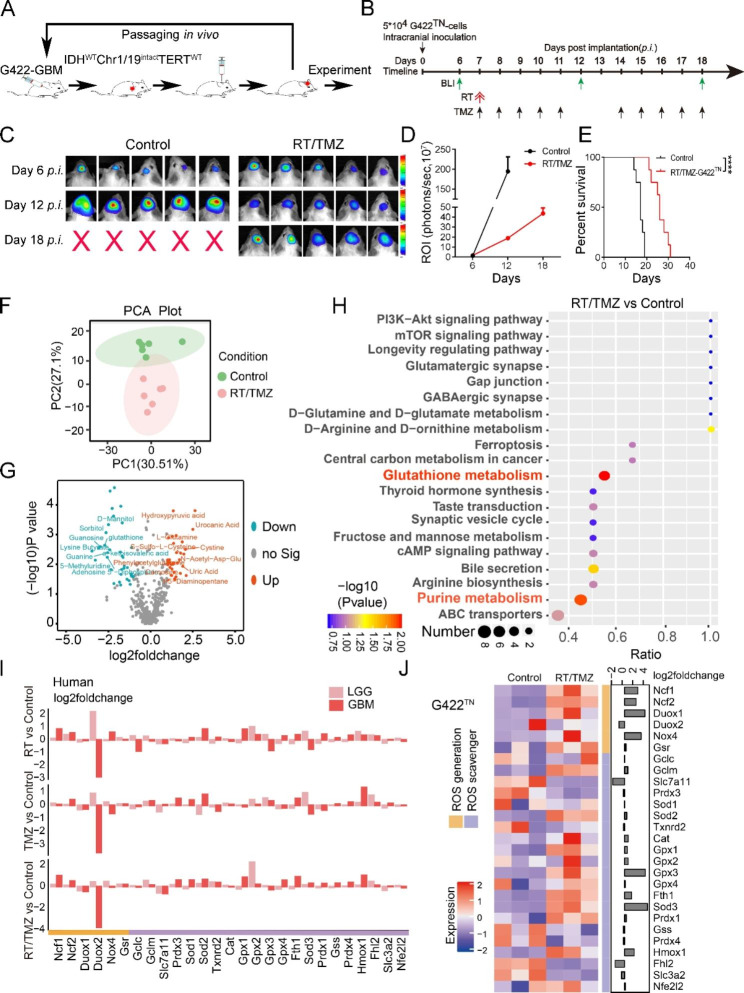
Fig. 1.
Early alteration of glutathione metabolism restricts RT/TMZ efficacy in orthotopic G422TN-tumor. A Schematic diagram of orthotopic G422TN-GBM mouse model establishment. B Schematic diagram depicting the bioluminescent images (BLI) once every six days started on day 6 p.i. and RT/TMZ regimen started on day 7 p.i. RT, a single dose of 10 Gy-whole brain irradiation (WBI); TMZ, 10 doses of TMZ during one therapeutic course with one oral gavage of 50 µg TMZ per gram of body weight in each dose. C and D Representative bioluminescent images and statistical analysis of the ROI values of the intracranial tumors in control and RT/TMZ-treated group monitored before and after RT/TMZ treatment (on day 6, 12 and 18, n = 8/group). E The Kaplan-Meier survivals of the G422TN-mice with RT/TMZ treatment and control group (n = 8/group). F The PCA plot of metabolomic data in control and RT/TMZ treatment. G The volcano plot of RT/TMZ treatment vs. control metabolites. H The top 20 differential pathways between the Control and RT/TMZ identified by the KEGG pathway enrichment analysis. I Gene expression profile of ROS generating and scavenging genes in CGGA database including RT treatment vs. control, TMZ treatment vs. control, and RT/TMZ treatment vs. control. J Gene expression profile of ROS generating and scavenging genes in control and RT/TMZ treatment. (****P < 0.0001)

