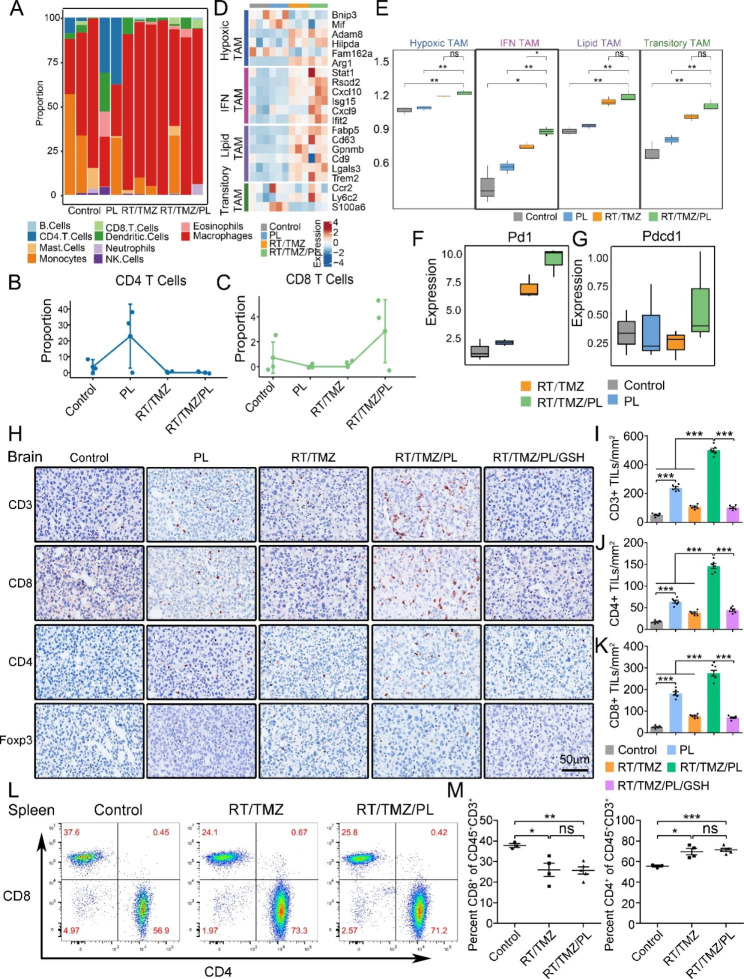
Fig. 6.
RT/TMZ/PL reshapes immunosuppressive microenvironment to induce CD3+/CD4+/CD8+ T cells infiltration in G422TN-tumors. A Immune cell proportion analysis in each sample. B and C The line chart illustrating CD 8 T cell and CD 4 T cell proportion in different treatments. D The heatmap illustrating expression of marker genes involved in Hypoxic TAMs, IFN TAMs, lipid TAMs and transitory TAMs in different treatments. E ssGSEA score of TAMs subtypes in different treatments. F and G Expressions of PD1 and PD-L1 in different treatments. H, I, J and K IHC staining (CD3, CD4, CD8 and Foxp3) and statistical analysis of G422TN-tumor in control, PL, RT/TMZ, RT/TMZ/PL, RT/TMZ/PL/GSH group on day 9 p.i. Scale bar, 50 μm. (n = 6). L and M Flow cytometric analysis of T cell gating and statistical analysis in spleen of mice of different groups (control, RT/TMZ and RT/TMZ/PL, n = 3–5). (*P < 0.05; **P < 0.01; ***P < 0.001; ns, not statistically significant)

