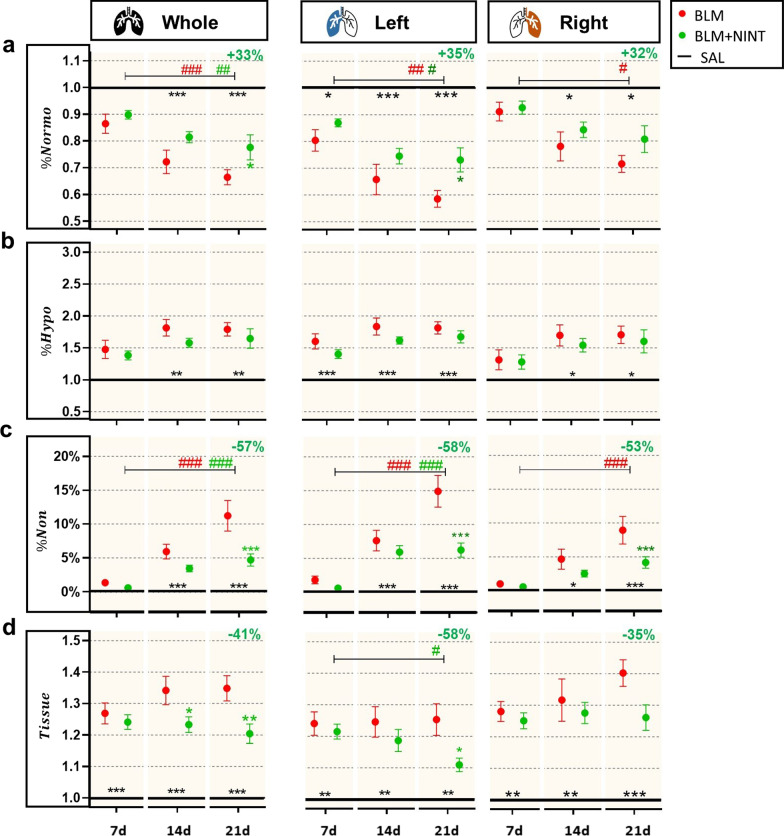
Fig. 3.
Longitudinal assessment of morphological µCT biomarkers in the P02 phase for the whole, left, and right lungs. A Quantification of the Normo-aerated compartment expressed as percentage (%Normo). B Quantification of the Hypo-aerated compartment expressed as percentage (%Hypo). C Quantification of the Non-aerated compartment expressed as a percentage (%Non). D Lung volume without gas (Tissue) quantification. All values reported for the BLM and BLM + NINT groups were normalized with respect to the mean values of the SAL group averaged on days 7, 14, and 21, except for %Non which is expressed as absolute percentage value. The black lines set at 1.0 represent the “untreated” condition obtained by dividing the SAL mean value by itself, while in C the black line is set at 0. BLM (red) and BLM + NINT (green) data are given as mean ± SEM. Statistical significance of longitudinal changes of CT parameters in the BLM and BLM + NINT groups was assessed by Two-way ANOVA followed by Šidák post-hoc test (#p < 0.05; ##p < 0.01; ### p < 0.001). Statistical significance of differences between groups was calculated by Two-way ANOVA followed by Dunnett’s t post-hoc test (*p < 0.05; **p < 0.01; ***p < 0.001 vs. BLM group) and the relative percentage of inhibition (−) or recovery (+) at 21 days was reported at the top right-side of each plot

