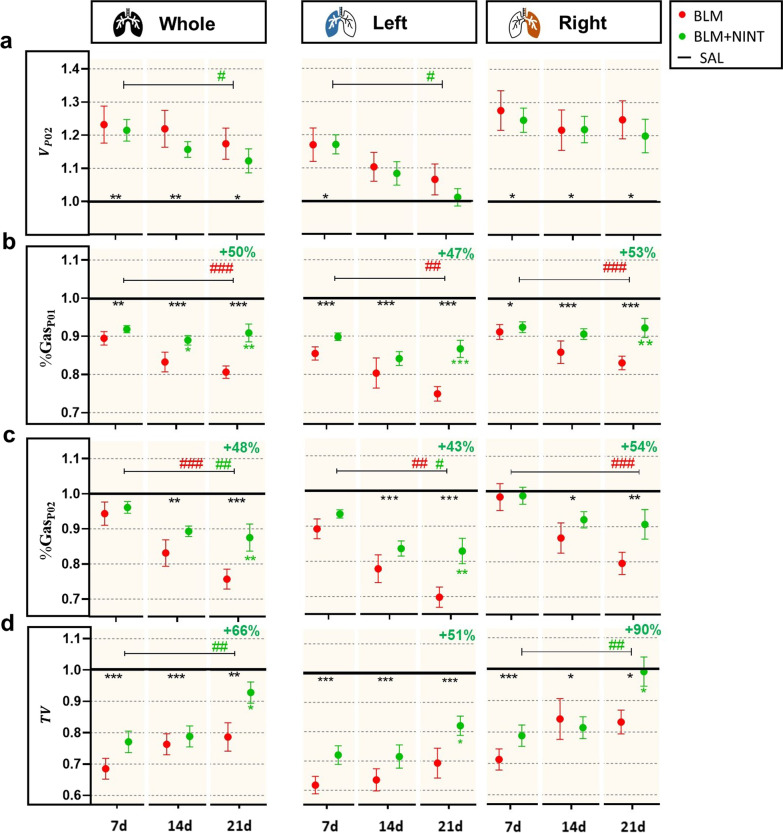
Fig. 4.
Longitudinal assessment of functional µCT biomarkers for the whole, left and right lungs in the respiratory phases P02 and P01. A Quantification of the Total Lung Volume at the end of expiration (VPO2). B Quantification of the air content at the end of inspiration expressed as percentage (%GasP01). C Quantification of the air content at the end of expiration expressed as percentage (%GasP02). D Quantification of the Tidal Volume (TV). All values reported for the BLM and BLM + NINT groups were normalized with respect to the mean values of the SAL group averaged on days 7, 14, and 21. The black lines arbitrarily set at 1.0 represent the “untreated” condition obtained by dividing the SAL mean value by itself. BLM (red) and BLM + NINT (green) data are given as mean ± SEM. Statistical significance of the longitudinal changes of CT parameters in the BLM and BLM + NINT groups was assessed by Two-way ANOVA followed by Šidák post-hoc test (#p < 0.05; ##p < 0.01; ###p < 0.001). Statistical significance of differences between groups was determined by Two-way ANOVA followed by Dunnett’s t post-hoc test (*p < 0.05; **p < 0.01; ***p < 0.001 vs. BLM group) and the relative percentage of inhibition (−) or recovery (+) at 21 days was reported at the top right-side of each plot

