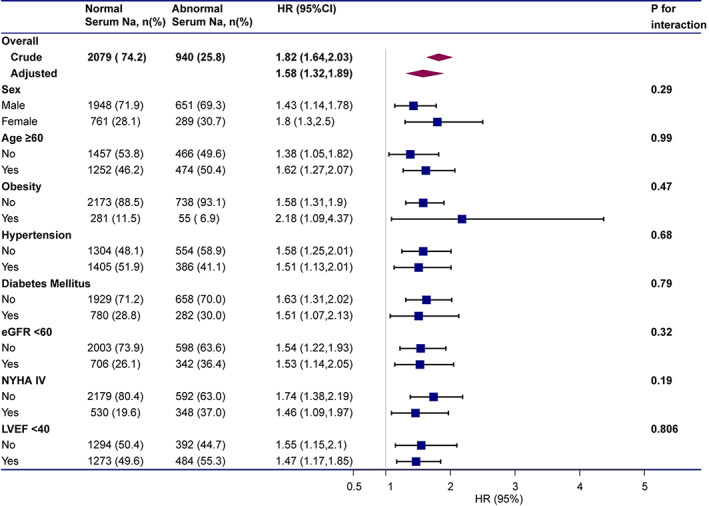
FIGURE 2.

Subgroup analyses of hazard ratios (95% confidence intervals) associated with mortality associated with abnormal serum sodium levels. The model adjusted for age, sex, BMI, hypertension, diabetes mellitus, smoking history, drinking history, ALT, AST, eGFR, abnormal serum potassium level, NT‐proBNP, NYHA functional class IV, LVEF, and pharmacotherapy except for the covariate, which was stratified.
