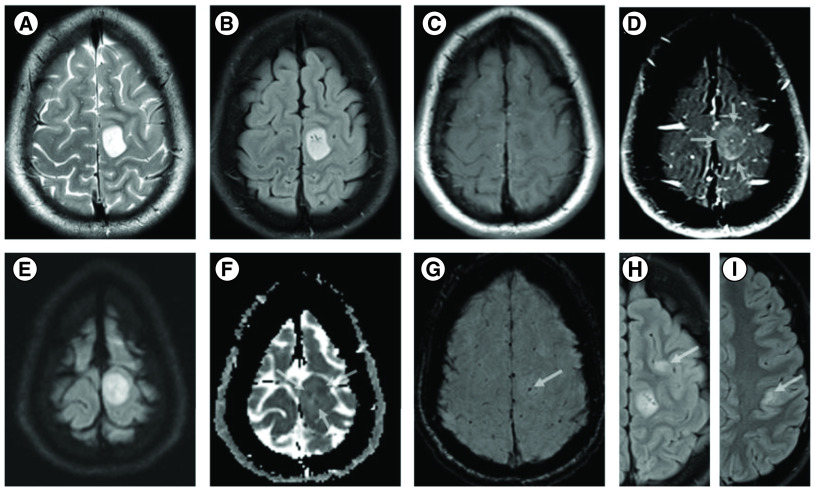
Figure 2. . MRI images of brain lesion.
MRI shows a well circumscribed cortical based 2.1 × 1.6 cm mass in the left peri-Rolandic region demonstrating hyperintense T2/FLAIR SI (A & B), hypointense T1-WI (C) and thick subtle incomplete ring enhancement on the postcontrast fat suppressed T1 WI (arrows) (D). DWI and ADC maps show internal foci of restricted diffusion (arrows) (E & F) and T2*-SWI images shows a punctate focus of intratumoral hemorrhage (arrow) (G). Axial FLAIR images and different axial levels showing similar but nonenhancing cortical/subcortical lesions in the left frontal and parietal lobes (arrows) (H & I).
DWI: Diffusion weighted imaging.

