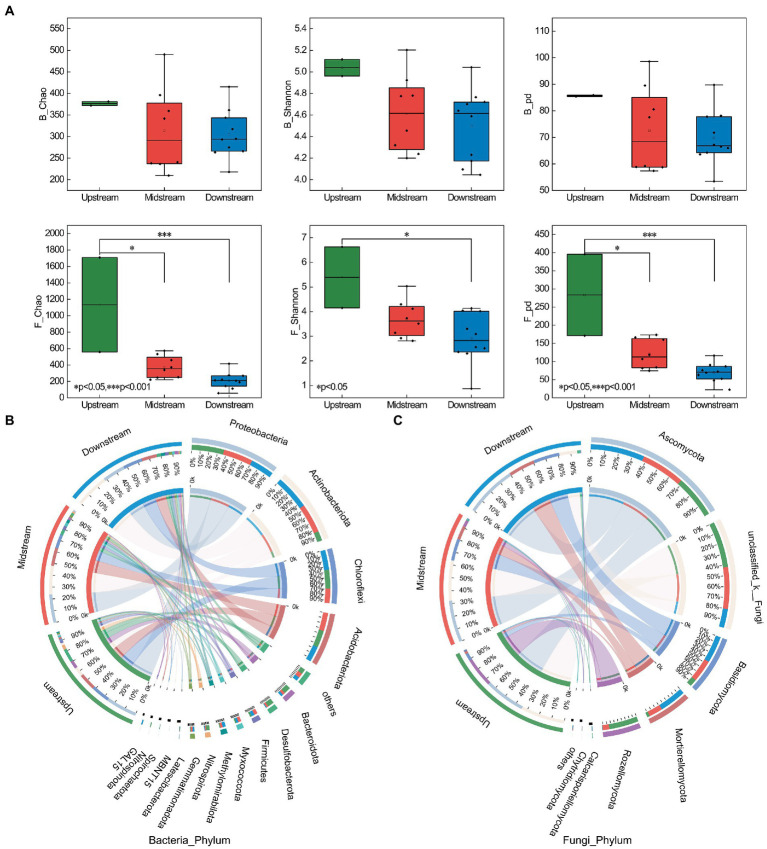
Figure 3.
The alpha diversity and microbial communities in riparian zones of the TGR. (A) Distribution of alpha diversity (bacteria and fungi) in the riparian zone (upstream, midstream, and downstream). (B) Relative abundance of bacterial communities at the phylum level (upstream, midstream, and downstream); B_Chao, Chao index of bacterial community; F_Chao, Chao index of fungal community. (C) Relative abundance of fungal communities at the phylum level (upstream, midstream, and downstream). *p < 0.05, **p < 0.01, ***p < 0.001.

