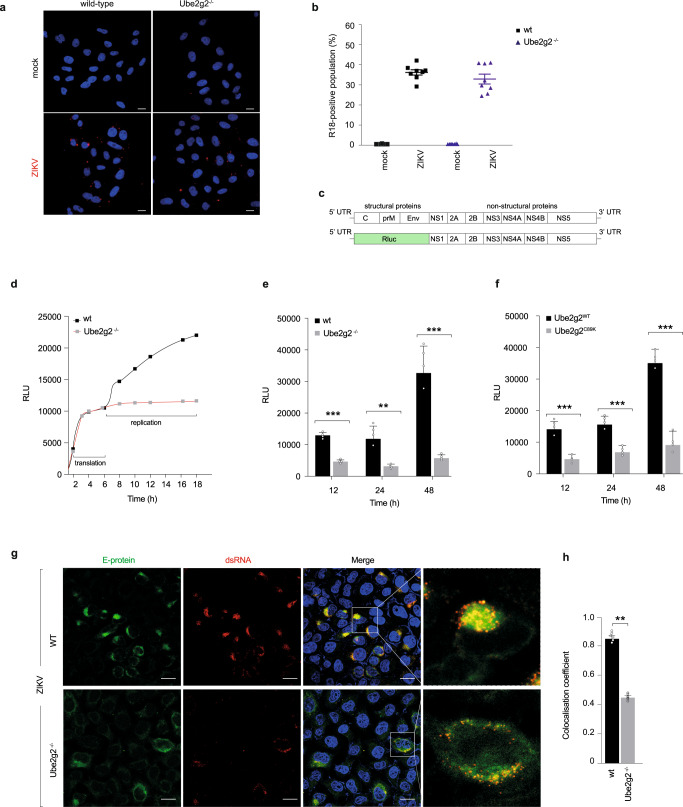
Fig. 2. Ube2g2-deficiency block virus replication.
a Wild-type and Ube2g2−/− cells were infected with either R18 labelled ZIKV at MOI 400 or pre-labelled control medium and visualised by immunofluorescence imaging. Hoechst staining indicates nuclei; red puncta structures indicate R18 labelled virus. b The R18 positive population was measured using flow cytometry at 2.5 hpi. Error bars represent mean ± SD, n = 3 biologically independent samples. c Schematic representation of Zika virus replicon; the structural gene segments are substituted with a luciferase reporter for activity readout. d–f Luminescence of ZIKV replicon RNA expressing luciferase in wild-type and Ube2g2−/− cells measured at indicated time points after transfection to measure translation (d) and virus replication in wild-type, Ube2g2−/−, Ube2g2WT and Ube2g2C89K cells (e, f). Data are presented as mean ± SD, n = 4 biologically independent samples (e, f). Luciferase activity is shown as relative luminescence units (RLU). **P < 0.01; ***P < 0.001 (compared with wild-type by ANOVA followed by one-sided Dunnett’s test). g, h Deletion of Ube2g2 affects the structure of intracellular viral replication and assembly complex. Wild-type and Ube2g2−/− cells were infected with Zika at MOI of 5. Cells were fixed at 24hpi and probed with anti-ZIKV envelope E-protein (488) and anti-double stranded (ds) RNA (555). Nuclei were visualised by Hoechst staining (g); Scale bar = 10 µM. Pearson’s correlation coefficient was measured to determine co-localisation (h). Error bars represent mean ± SD, n = 6 biologically independent samples; **P < 0.01; ***P < 0.001 (compared with wild-type by ANOVA followed by one-sided Dunnett’s test). (Source data are provided as a Source data file).

