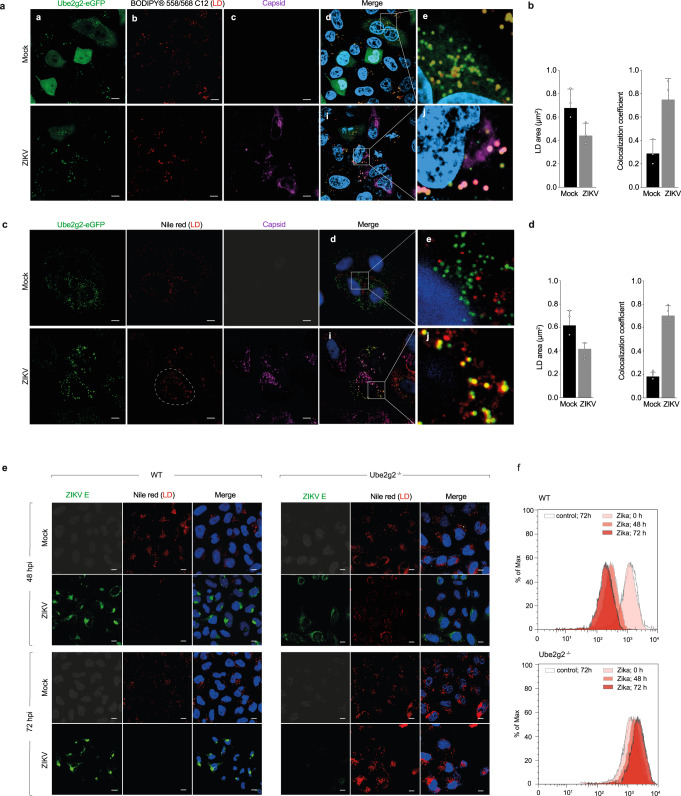
Fig. 5. Ube2g2 regulates lipophagy in virus-infected cells.
a–d Wild-type cells expressing GFP-Ube2g2 were either mock or Zika-infected at a MOI of 5. Cells were fixed at 24hpi and probed for Ube2g2 and LDs. LDs were stained with either BODIPY-C12 (a, b) or Nile red dye (c, d). Nuclei were stained with Hoechst; (Scale bars = 5 µm). Co-localisation of Ube2g2 with LDs was measured using Pearson’s correlation coefficient. Quantification of the average Nile red-positive area per cell (μm2) was performed using “Analyze Particles” macro in ImageJ from >500 cells per condition; outlined region demarcates area per cell. Data is presented as mean ± SD, n = 3 biologically independent samples (b, d). e Wild-type and Ube2g2−/− cells were infected with ZIKV at MOI 5. Cells were fixed at 48hpi and 72hpi and probed with anti-ZIKV envelope protein (488). LDs were stained with Nile red dye. Nuclei were stained with Hoechst. (Scale bars = 5 µm). f LDs in mock and Zika-infected wild-type and Ube2g2−/− cells were quantitated by flow cytometry at 48 h and 72 h post infection. (Source data are provided as a Source data file).

