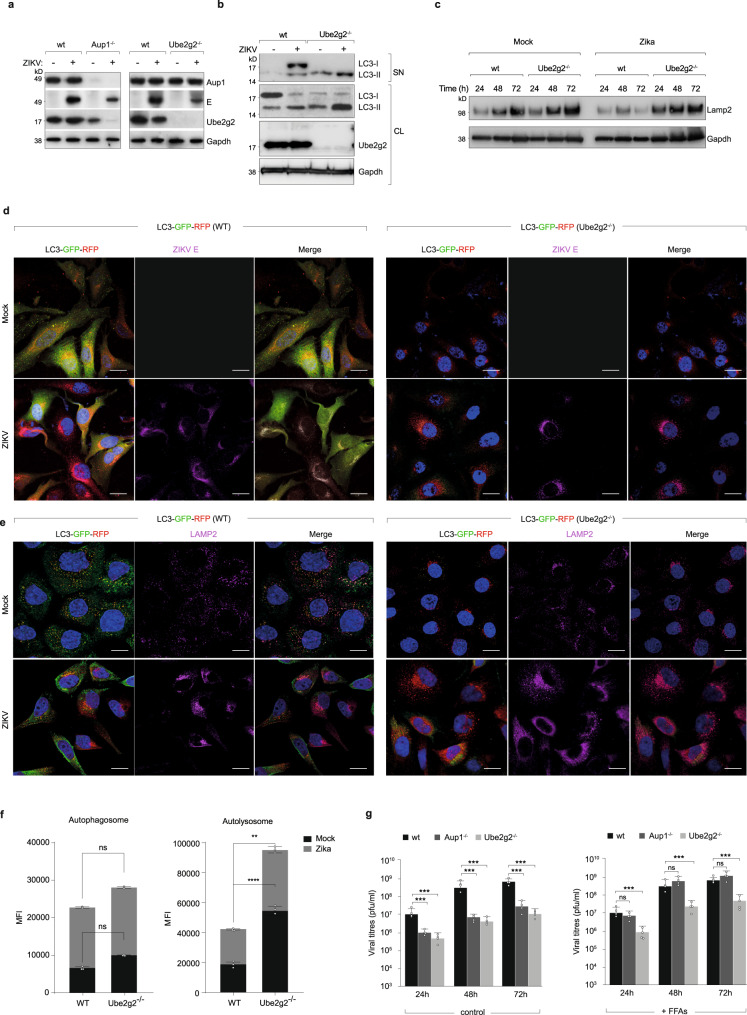
Fig. 6. Ube2g2-deficiency results in excessive autophagic flux.
a. Lysates from mock or Zika-infected wild-type, Aup1-/- and Ube2g2−/− cells (48 hpi) were immunoblotted for viral E-protein along with Aup1 and Ube2g2. b, c Supernatants and lysates from wild-type and Ube2g2−/− were immunoblotted for LC3 (b) and Lamp2 (c). d Wild-type and Ube2g2−/− cells stably expressing LC3-GFP-RFP were infected with ZIKV at MOI of 5. Cells were fixed at 24hpi and probed with anti-E protein (magenta) to visualise autophagosomes/lysosomes and viral protein distribution. Hoechst staining (Blue) was used to stain nuclei. (Scale bars = 10 µm). e Wild-type and Ube2g2−/− cells stably expressing LC3-GFP-RFP (HeLa-Difluo) were infected with ZIKV at MOI = 5. Cells were fixed at 24hpi and probed with anti-LAMP2 (647) to visualise autophagosomes/autolysosomes and lysosomes. (Scale bars = 10 µm). Hoechst staining (Blue) was used to stain nuclei. f Abundance of autophagosomes and autolysosomes was determined using flow-cytometry using cells described above (d, e). Data are presented as mean ± SD, n = 3 biologically independent samples; **P < 0.01; ****P < 0.0001 (compared with wild-type by ANOVA followed by one-sided Dunnett’s test). g Wild-type, Aup1−/− and Ube2g2−/− cells were mock or virus-infected and grown in medium supplemented with -/+ FFAs (10 mM) conjugated to BSA for indicated time points. Viral titres were measured using plaque assay. Data are presented as mean ± SD, n = 4 biologically independent samples; ***P < 0.001 (compared with wild-type by ANOVA followed by one-sided Dunnett’s test). (Source data are provided as a Source data file).

