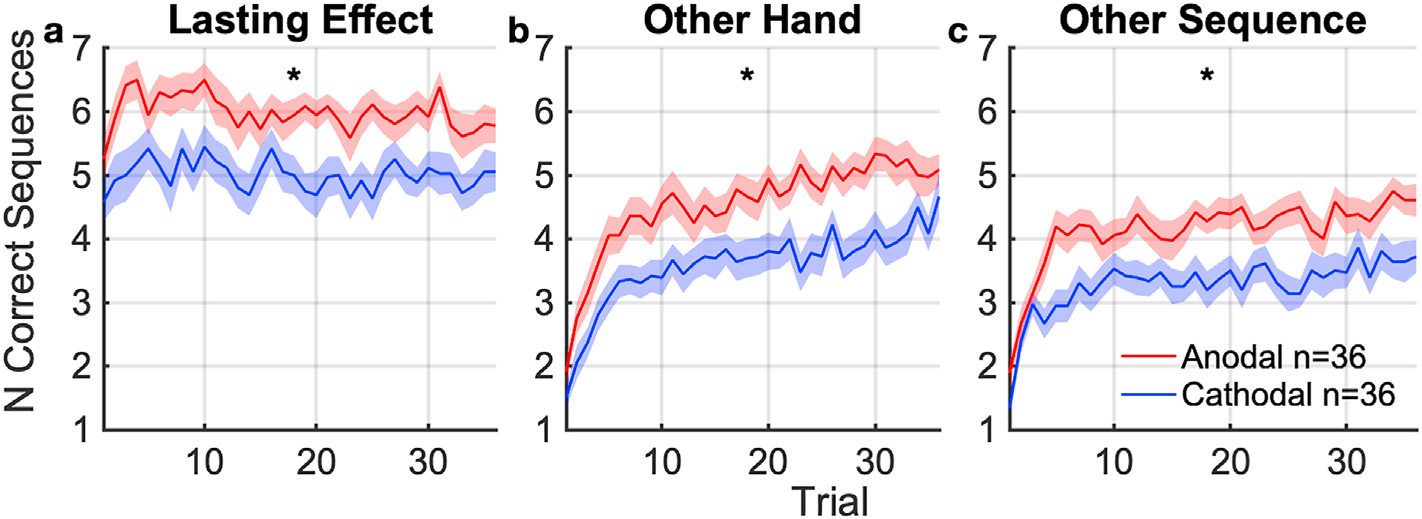
Fig. 5. Carry-over effects of stimulation on performance and learning.

Number of correct sequences completed per trial during followup tasks, averaged across subjects. (mean: solid curve, SEM: shaded area, * indicates significant difference at p < 0.05) between anodal and cathodal groups. (a) Performance with the same hand (left) and same sequence, tested 60 min after tDCS. This captures lasting learning effects of the targeted hemisphere and sequence. (b) Learning of a new sequence with the opposing (right) hand 72 min after tDCS. This captures lasting carry-over effects on learning to the other hand. (c) Learning of a new sequence with the same (left) hand 84 min after tDCS. This captures lasting carryover effects to learning of other sequences.
