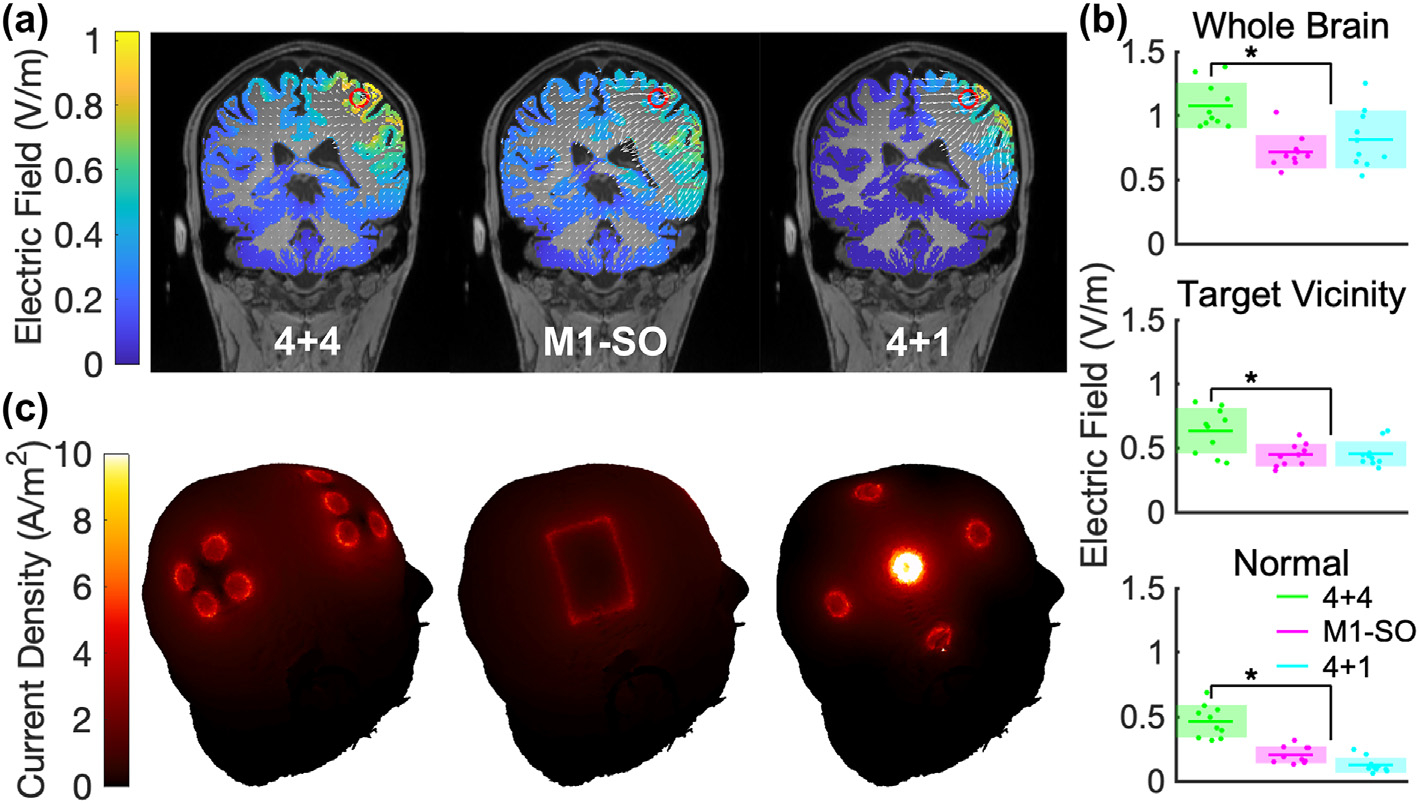
Fig. 8. Comparisons of ROAST current flow modeling results between different tDCS configurations, each delivering 4 mA total current.

Models were generated from N = 10 MRI heads. (a) Coronal views of electric field delivered to gray matter with the respective montages. The red circle marks the target and white arrows represent electric field vectors. Results from one head shown as an example. (b) Estimated electric field intensities as measured in gray matter across the whole brain, within 1 cm of the target voxel, and along the normal vector on the target voxel. Individual points represent a measurement from each of 10 heads. The colored horizontal line represents the average and the shaded area represents the standard deviation. * denotes a significant difference between 4+4 and M1-SO. (c) 3D visualizations of current density on the skin with 4+4, M1-SO, and 4+1 tDCS montages, in the same order as in (a).
