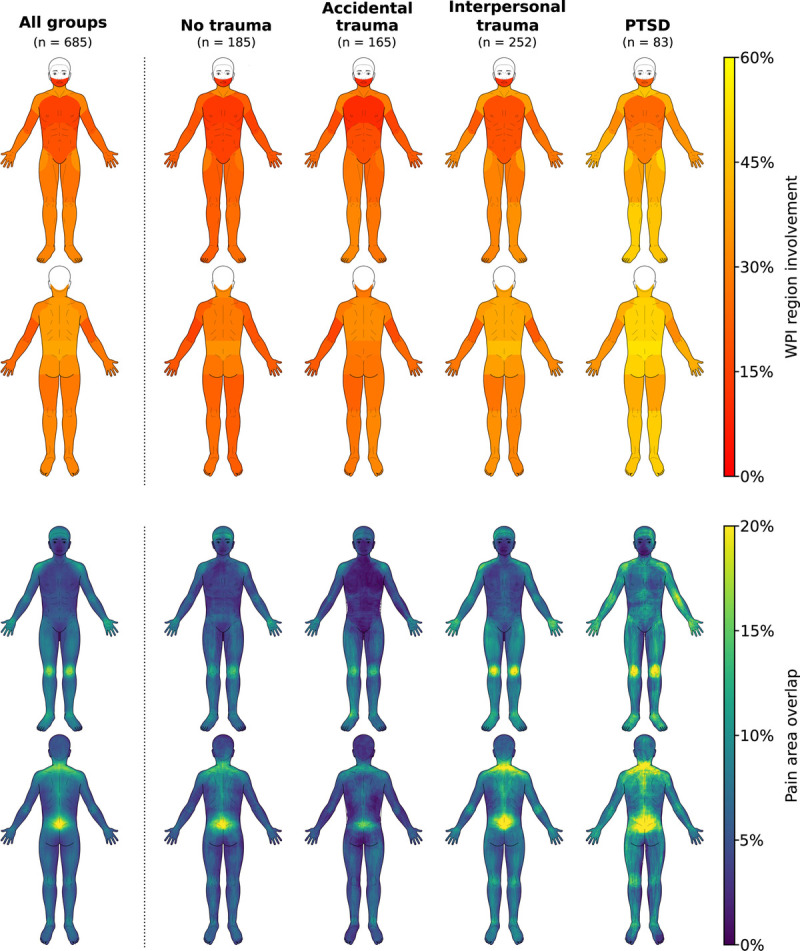
FIGURE 1.

Cross-correlation matrix of all measures. **p < .01; ***p < .001. Color image is available only in the online version of the article.

Cross-correlation matrix of all measures. **p < .01; ***p < .001. Color image is available only in the online version of the article.