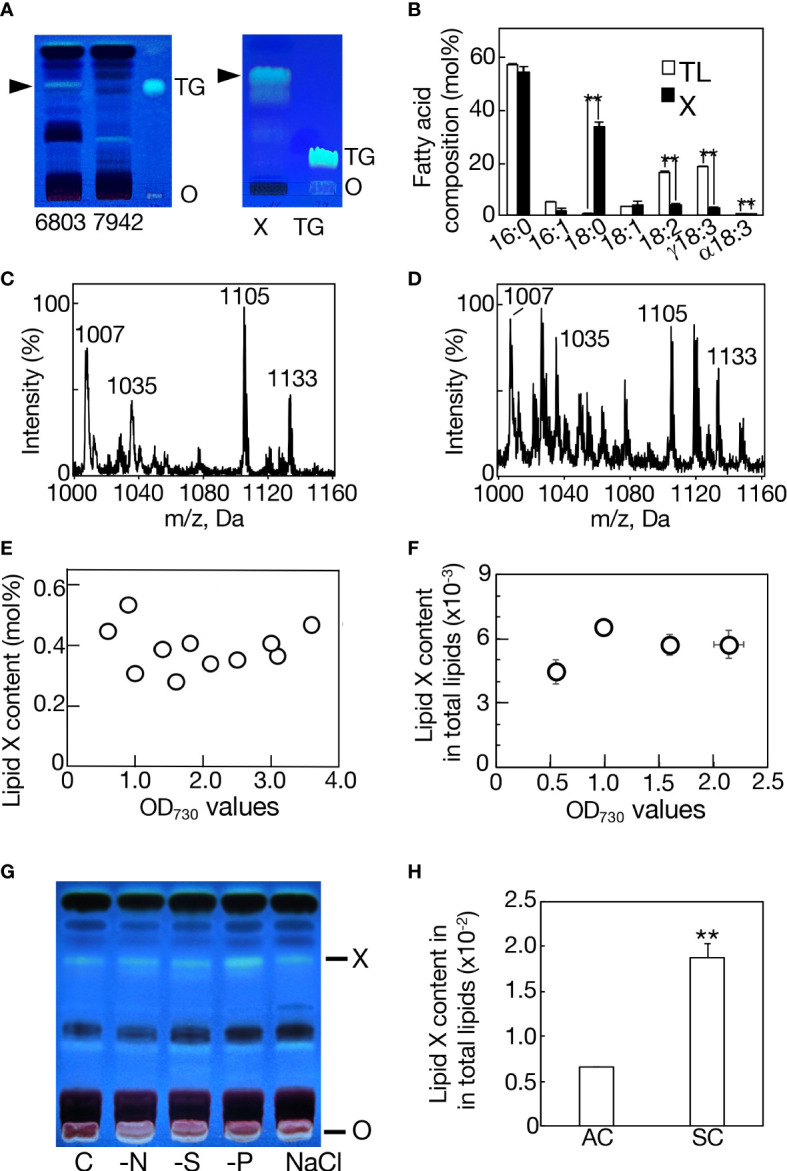
Figure 1.

Characterization of lipid X in Synechocystis. (A) TLC profiles of total lipids in Synechocystis (6803) and Synechococcus (7942) with a solvent system of hexane/diethyl ether/acetate (70:30:1 by vol.) (left panel), and that of lipid X prepared from Synechocystis by TLC, as in the left panel, with another solvent system of 100% toluene (right panel). Arrowheads indicate the position of lipid X. O, origin. TG indicates a marker TG. (B) Fatty acid compositions of total lipids (TL) and lipid X (X). MS spectrum of TLC-prepared lipid X (C) or that of a lipid fraction (retention time of 15-17 min, m/z 1000-1160), including lipid X, in total lipids (D) on LC-MS analysis in Synechocystis. (E) Quantitative behavior of lipid X based on constituent fatty acid contents of TLC-prepared lipid X in total lipids on GC-analysis. (F) Quantitative behavior of a lipid fraction (retention time of 15-17 min, m/z 1000-1160), including lipid X, on LC-MS analysis of total lipids relative to total lipids (retention time of 2-18 min, m/z 200-1200) during cell growth in an aeration culture, based on the signal intensities on LC-MS analysis. (G) TLC profiles of lipid X in total lipids from aeration-cultured cells subjected to nitrogen-, sulfur- or phosphorus-deficiency (-N, -S or -P) stress, or 0.6 M NaCl stress. (H) Quantitative behavior of a lipid X fraction relative to total lipids in a static culture (SC) or in an aeration culture (AC), based on the signal intensities on LC-MS analysis, as in (F). The values shown are averages ± SD for three experiments. The significance of differences was evaluated by means of Student’s t-test. **P<0.05.
