Figure 4.

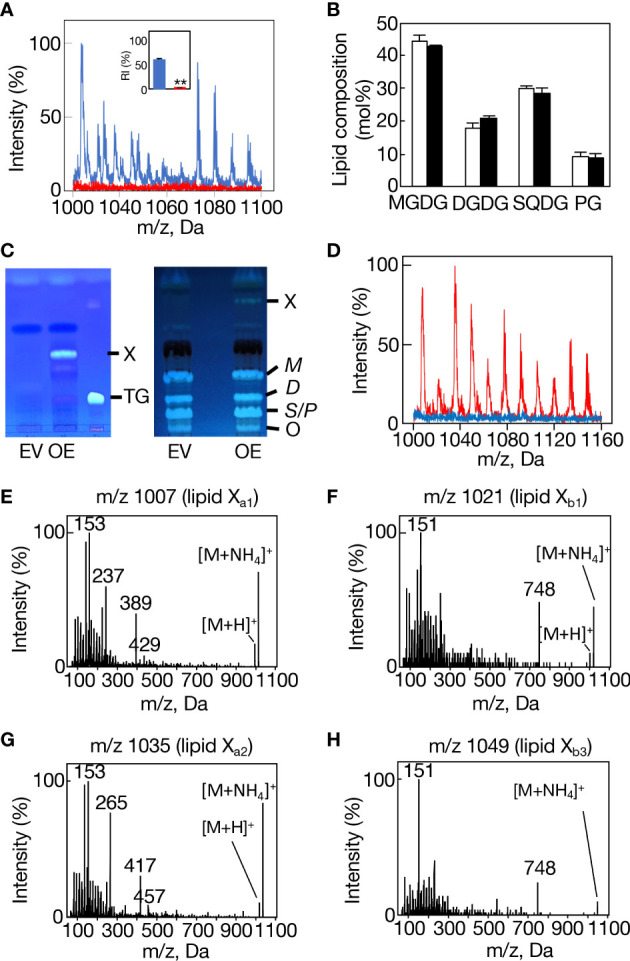
Loss-of-function and gain-of-function analyses of slr2103. (A) MS spectrum of a lipid fraction (retention time of 15-17 min, m/z 1000-1160), including lipid X, on LC-MS analysis of total lipids prepared from WT cells (blue) or Δslr2103 ones (red). The signal intensity of m/z 1007 relative to a total lipid fraction (retention time of 2-18 min, m/z 200-1200) in the WT was adjusted to 100%. Inset, the estimated relative signal intensity of the lipid X fraction. The WT value was adjusted to 100%. (B) Polar lipid composition of Δslr2103. White and black bars indicate the WT and Δslr2103, respectively. (C) TLC-profiles of a lipid X fraction with a solvent system of 100% toluene (left). The lipid X fraction in OE or its counterpart in EV, which was obtained through TLC of total lipids with a solvent system of hexane/diethyl ether/acetate (70:30:1 by vol.), was then subjected to another TLC with a solvent system of 100% toluene. Note that OE but not EV showed lipid X that was quite distinct from a marker TG in mobility. The two-step TLC-profiles of total lipids (right). Note that the two-step TLC enabled not only separation of lipid X from polar lipids but also that of polar lipids into three fractions, MGDG (M), DGDG (D), and SQDG (S)+PG (P). (D) MS spectrum of the lipid fraction, including lipid X, on LC-MS analysis of total lipids prepared from EV cells (blue) or OE ones (red), with the signal intensity of m/z 1007 in OE relative to the total lipid fraction adjusted to 100%. MS2 spectrum of m/z 1007 (E), m/z 1021 (F), m/z 1035 (G), or m/z 1049 (H).
