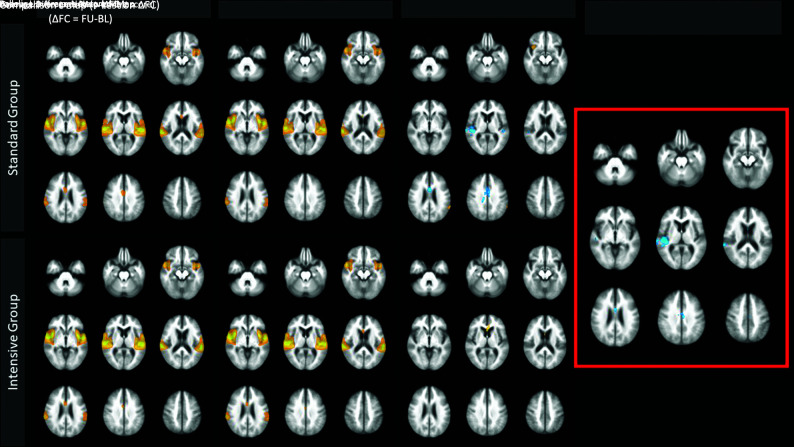
FIG 2.
Voxelwise t test comparing the longitudinal change of the ASLN between treatment groups. Comparison t map on the right (red box) demonstrates regions of significantly more negative change with time in the standard group compared with the intensive group in the cingulate region and right posterior insula and temporal lobe. Clusters are significant to P < .0001 family-wise error–corrected. BL indicates baseline; FU, Follow-up.

