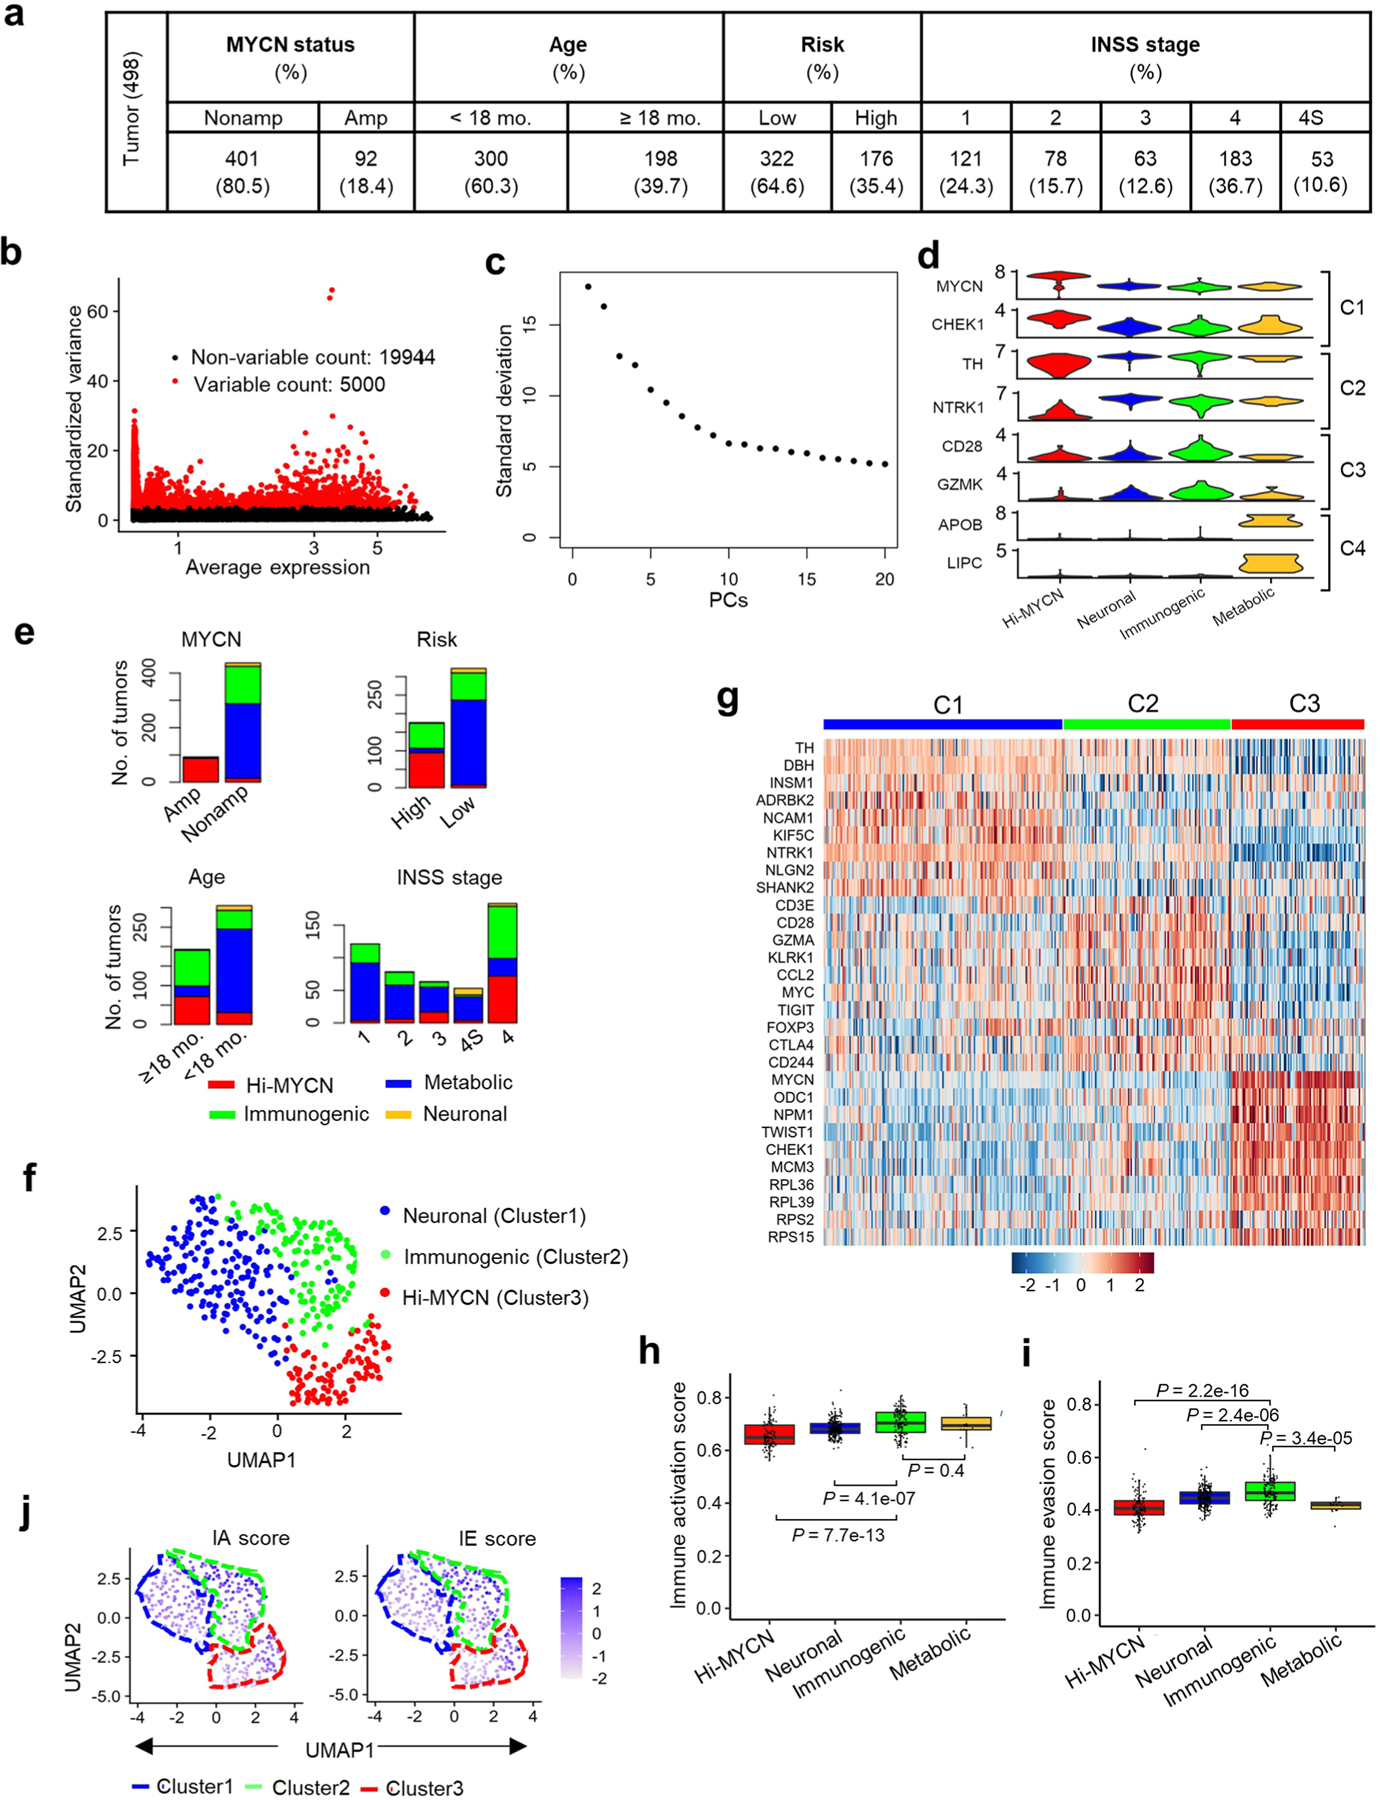
Extended Data Fig. 1 |. Tumors within the immunogenic cluster express both IA and IE markers.

a, Distribution of the 498 primary NB tumors in the data set (SEQC-498; GSE49711) within the indicated prognostic categories. Risk stratification was based on the Children’s Oncology Group risk classification. INSS, International Neuroblastoma Staging System32. b, Scatter plot of the standardized variance in expression of all protein coding genes within the 498 tumors. Red dots indicate the top 5000 variably expressed genes. c, Elbow plot representing the percentage variance for the top 20 principal components, PCs (n = 20). d, Violin plots showing the expression of representative marker genes across the four clusters in 498 tumors. e, Stacked bar plots showing the distribution of tumors within the defined prognostic features within each cluster. Amp, amplified; Nonamp, nonamplified. f, Two-dimensional UMAP representations of the gene expression profiles in 394 NB tumors (GSE120572). Each dot represents a tumor. The top 3000 highly variable genes were selected based on the variance-stabilizing method33 and 20 significant principal components (PCs) selected and processed in UMAP to generate three clusters representing three NB subtypes. The DEGs were identified for each cluster using the receiver operating characteristics (ROC) curve to compare one cluster with others (log2 FC > 0.25). g, Heat map of expression values of 10 representative DEGs within each cluster in (f). Rows are z-score scaled average expression levels for each gene in all three clusters. h, i, Box plots comparing IA (h) and IE (i) scores within the four clusters (n = 103 tumors in Hi-MYCN, 241 in neuronal, 140 in Immunogenic and 14 in metabolic) from the SEQC-498 tumor data set. All box plots are defined by center lines (medians), box limits (25th and 75th percentiles) and whiskers (minima and maxima; the smallest and largest data range). Significance was determined by the two-tailed Wilcoxon rank-sum test. j, UMAP visualization of the distribution of IA and IE scores among the three tumor clusters derived from the 394 NBs in the GSE120572 dataset. Color bar represents normalized z-scores. Values <2.5 and >2.5 were set to −2.5 and +2.5, respectively, to reduce the effects of extreme outliers.
