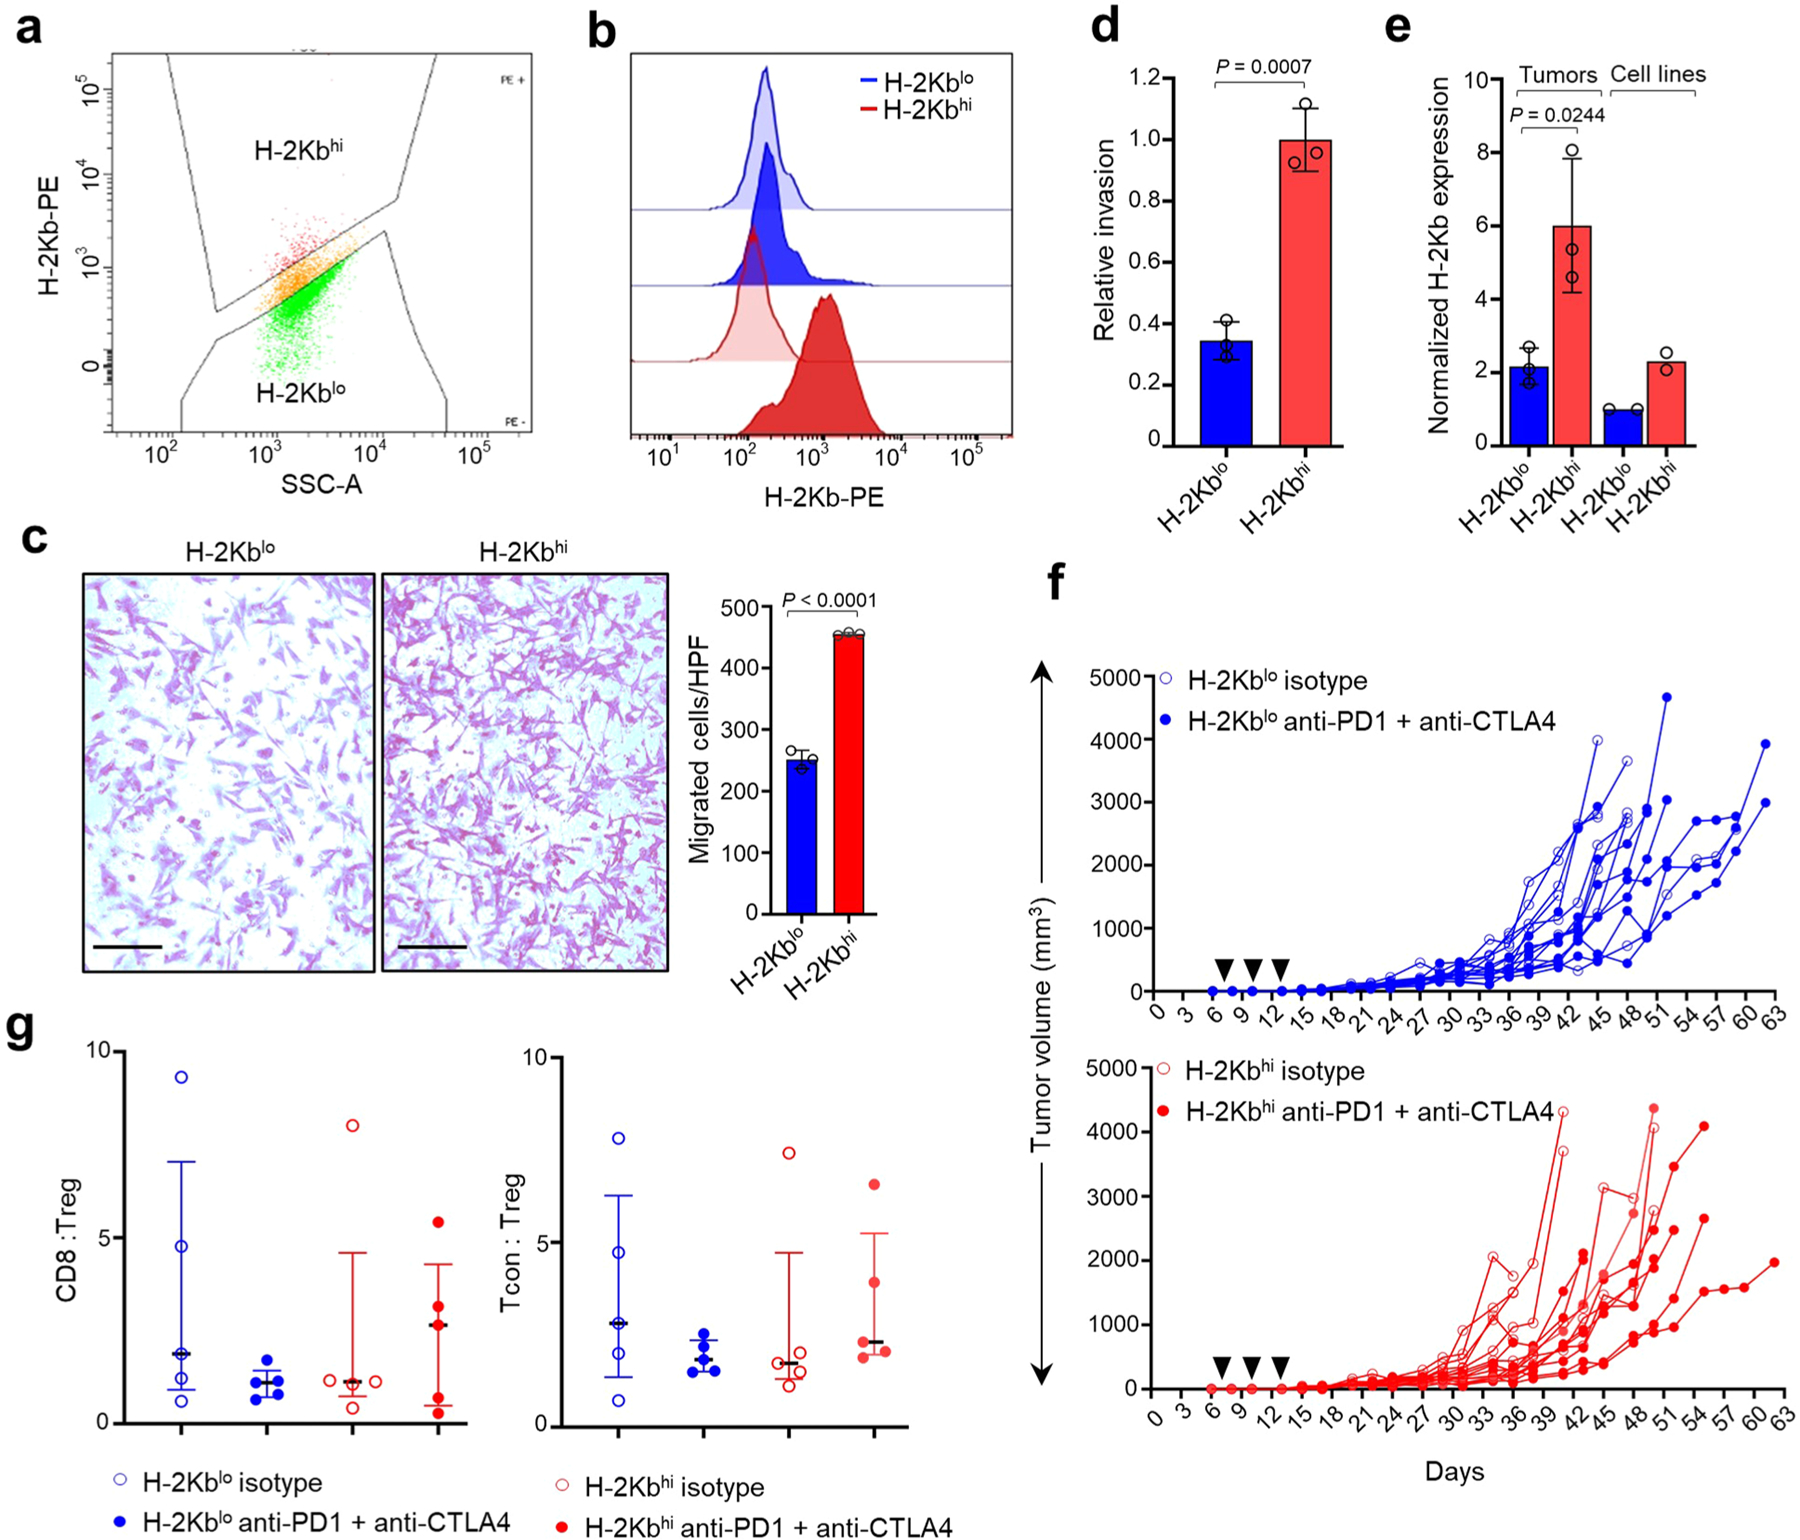
Extended Data Fig. 10 |. Tumors derived from NB-9464 H-2Kbhi cells show mesenchymal properties.

a, FACS plot showing gating conditions for sorting NB-9464 cells into H-2Kbhi and H-2Kblo populations. X-axis, side scatter; Y axis, H-2Kb fluorescence intensity. A logscale expression value of 103 was used to gate H-2Kbhi (≥ 103) and H-2Kblo (<103) populations. b, FACS analyses of H-2Kb expression (dark colored histograms) in H-2Kblo and H-2Kbhi cells compared to isotype controls (light colored histograms). Plots representative of 2 independent experiments. c, Left, Bright field images of crystal violet-stained H-2Kblo and H-2Kbhi cells in transwell migration assays. Scale bar, 100 µm. Right, Quantification of migrating cells per high-power field (HPF). Data represent mean ± SD of cells from three HPFs per cell line, significance derived using unpaired two-tailed Student’s t-test. Data representative of n = 3 independent experiments. d, Quantification of the relative invasiveness of H-2Kblo and H-2Kbhi cells. Data represent mean ± SD from three technical replicates, significance derived using unpaired two-tailed Student’s t-test. Data representative of 2 independent experiments. e, RT-qPCR analysis of H-2Kb expression in H-2Kblo and H-2Kbhi tumors and the cell lines from which they were derived. Data were normalized to H-2Kb expression in H-2Kblo cells and represent mean ± SD, n = 3 tumors per group, P determined by the unpaired two-tailed Student’s t-test. f, Tumor volumes in C57BL/6 mice injected subcutaneously with 1 ×10⁶ H-2Kblo or H-2Kbhi cells and treated with anti-PD1 + anti-CTLA4 antibodies or isotype control (black arrowheads) on days 7, 10, and 13 after tumor inoculation. Data represent growth of individual mouse tumors, n = 8, H-2Kblo isotype; n = 7, H-2Kblo anti-PD1 + anti-CTLA4; n = 8, H-2Kbhi isotype; n = 8, H-2Kbhi anti-PD1 + anti-CTLA4. g, FACS analysis of the ratios between tumor infiltrating CD8 + T or conventional T (Tcon) and Treg cells (CD8:Treg and Tcon:Treg, respectively) in H-2Kblo and H-2Kbhi tumors treated with isotype control or anti-PD1 + anti-CTLA4 antibodies. Data represent medians with interquartile ranges, n = 5 tumors per group.
