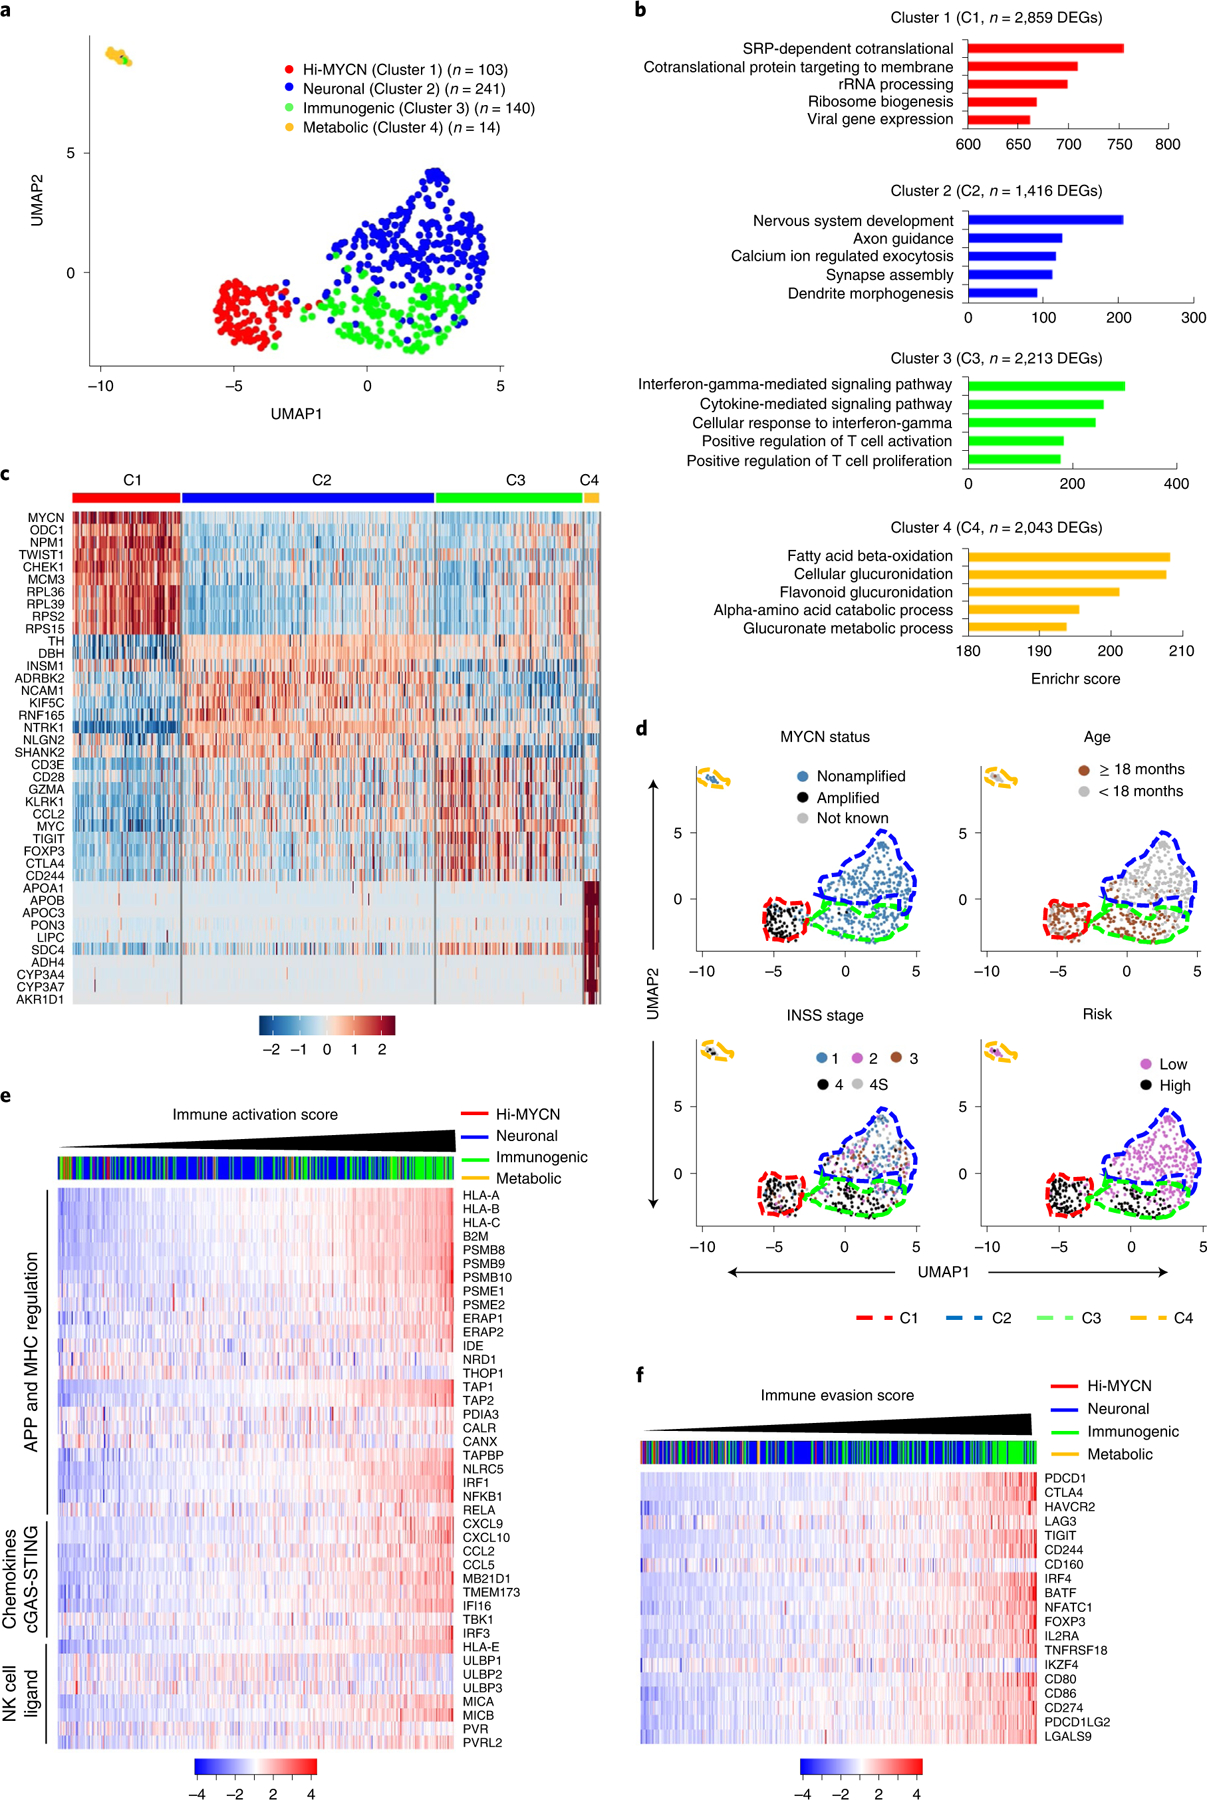
Fig. 1 |. A subset of neuroblastomas expresses signatures of an immune response.

a, Two-dimensional UMAP representations of the gene expression profiles in 498 neuroblastoma (NB) tumors. Each dot represents a tumor. The top 5,000 highly variable genes were selected based on the variance-stabilizing method and 20 significant principle components (PCs) selected and processed to generate clusters representing four NB subtypes. Differentially expressed genes (DEGs) were identified for each cluster using the receiver operating characteristics (ROC) curve to compare one cluster with the other three (log2FC > 0.25). b, GO analysis of DEGs in the four clusters. Significance was assessed by the two-tailed Fisher’s exact test. c, Heat map of expression values of ten representative DEGs within each cluster. Rows are z-score-scaled average expression levels for each gene in all four clusters. d, UMAP visualization of the distribution of the indicated prognostic features among the four clusters. e,f, Heat map of z-score-transformed log2 normalized expression values of IA (e) and IE (f) genes in MYCN-nonamplified NBs (n = 401 tumors). Tumors were ranked based on increasing IA or IE scores. Cluster annotations of the tumors are indicated on the top horizontal bar.
