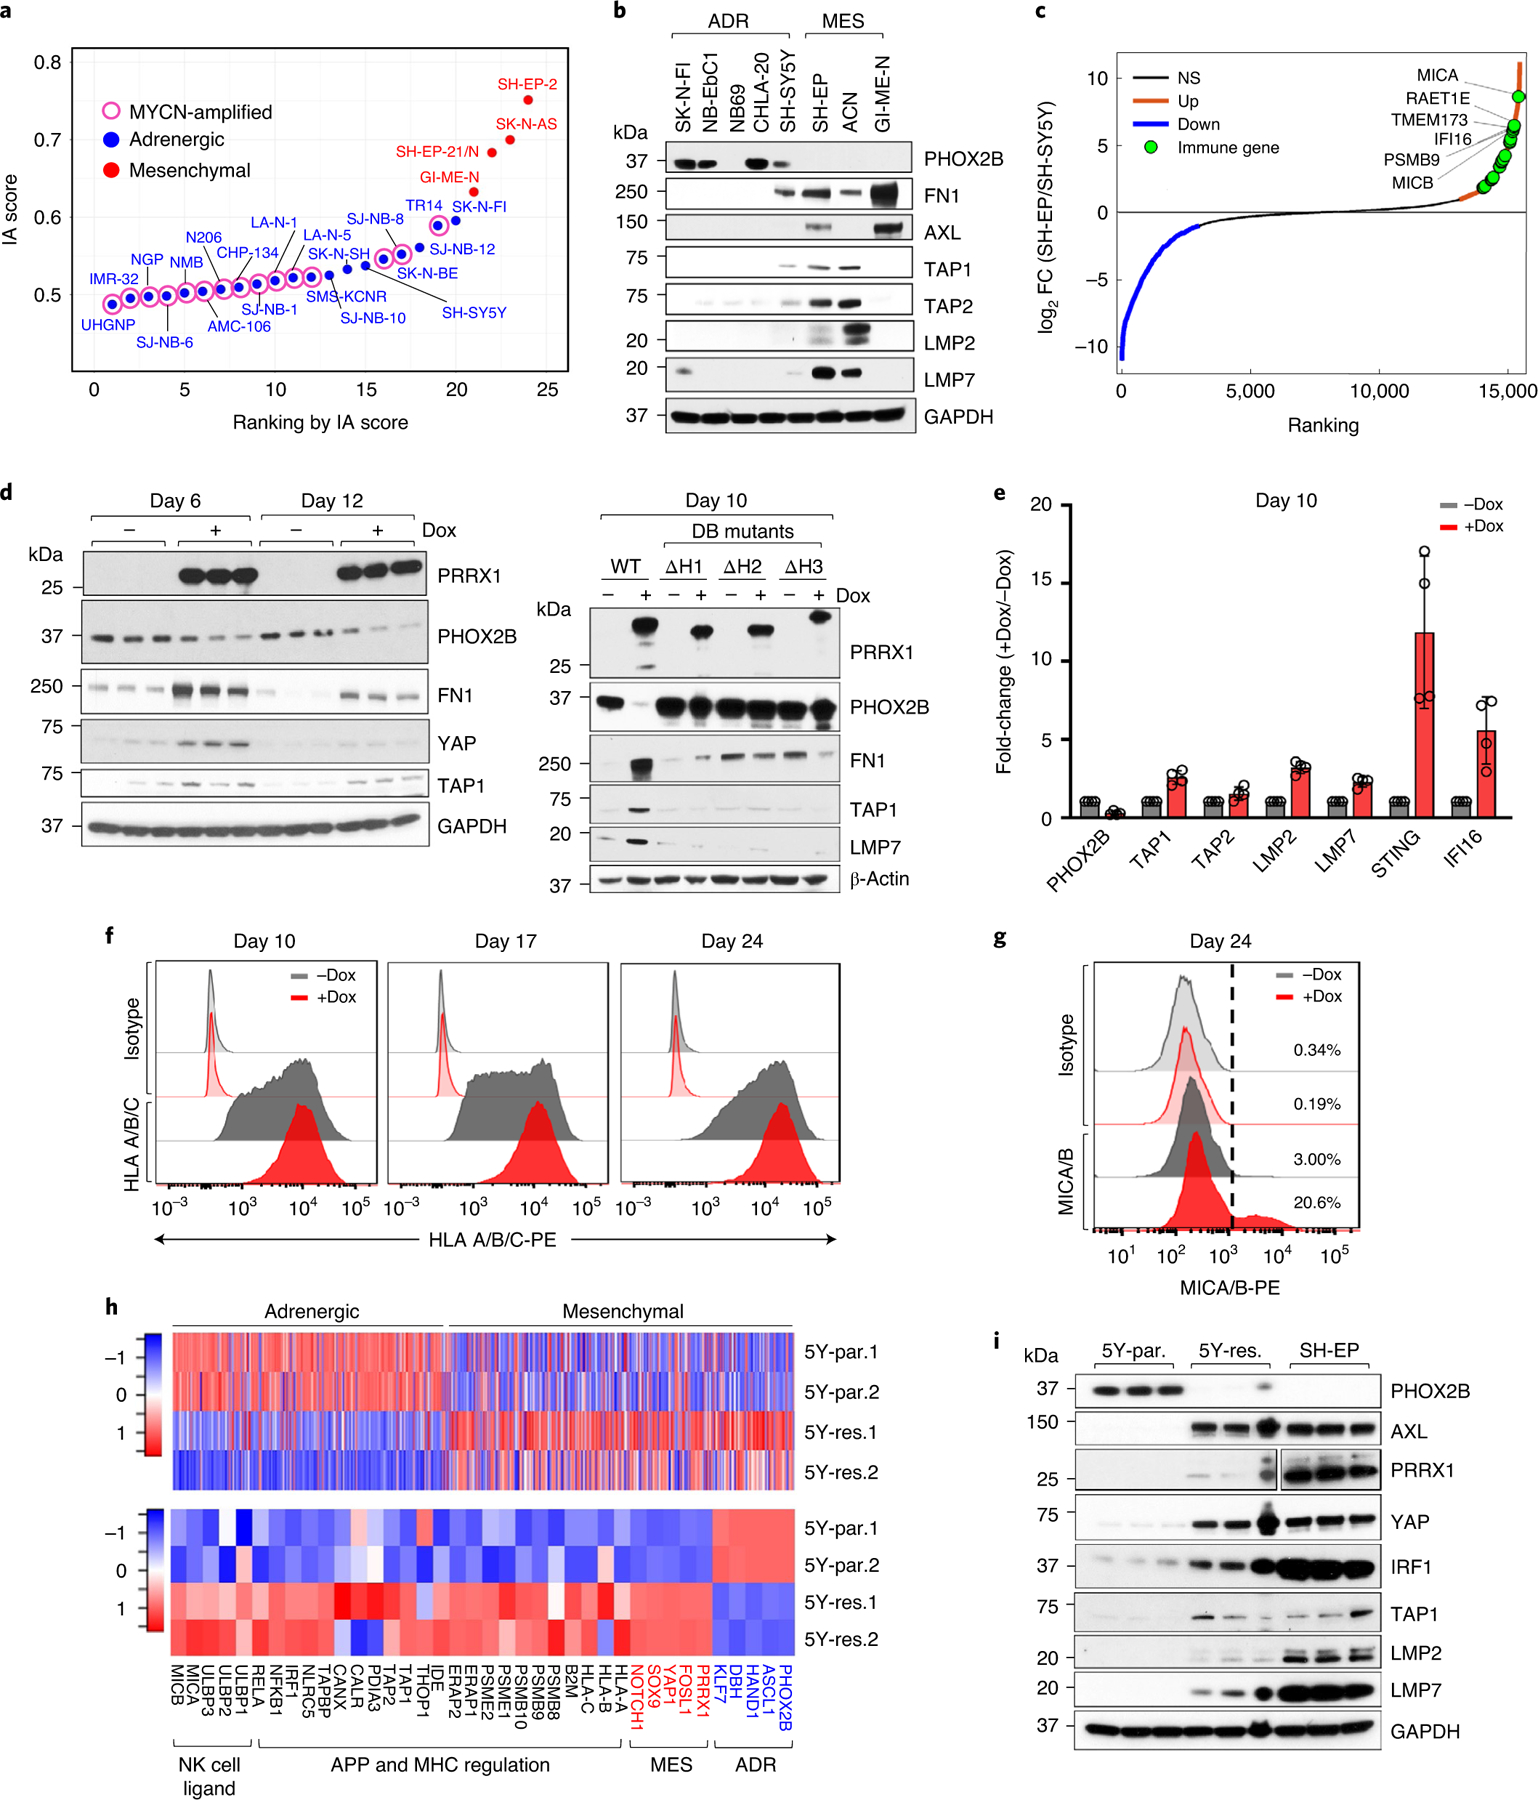
Fig. 3 |. Reprogramming adrenergic cells to the mesenchymal lineage induces immune gene expression.

a, Scatter plot of IA scores in human NB cell lines arranged based on increasing scores and designated as adrenergic or mesenchymal based on lineage-specific gene expression. b, Western blot (WB) analysis of lineage markers and APPs in NB cells (n = 2 independent repeats). c, Waterfall plot of the fold-change in RNA expression levels of up- and downregulated genes in SH-EP compared with SH-SY5Y cells. Significance was determined by the two-tailed Wald test. d, Left: WB analysis of the indicated proteins in SH-SY5Y cells expressing dox-inducible PRRX1 in the presence or absence of dox (200 ng ml−1) at the indicated time points (n = 3 independent experiments). Right: WB analysis of the indicated proteins in SH-SY5Y cells expressing WT or DNA-binding (DB) mutants of PRRX1 (n = 1 independent experiment). e, RT–qPCR analysis of immune response genes in the same cells as in d. Data represent mean ± standard deviation (s.d.) (n = 4 independent experiments). f, FACS analysis of HLA expression following PRRX1 overexpression in SH-SY5Y cells at the indicated time points. PRRX1 induction for 10, 16 and 23 days led to a 2.07 ± 0.127 (P = 0.0066), 1.95 ± 0.097 (P = 0.0031) and 1.61 ± 0.021 (P < 0.0001) fold increase in HLA geometric mean fluorescent intensity (gMFI), respectively. Data represent mean ± s.d. (n = 3 independent experiments); two-tailed paired Student’s t-test. g, FACS analysis of MICA/MICB expression after PRRX1 induction for 24 days as in f. Plots are representative of two independent experiments. h, Heat maps of lineage gene signatures (top), and individual lineage marker, APP and NKG2D ligand gene expression (bottom) in 5Y-par. and 5Y-res. cells (n = 2 independent experiments). Rows represent z-scores of log2 expression values. i, WB analysis of lineage marker and APP pathway genes in the indicated cells (n = 3 independent experiments). PRRX1 panels represent two different exposures. GAPDH or β-actin was used as loading control in immunoblots. NS, not significant.
