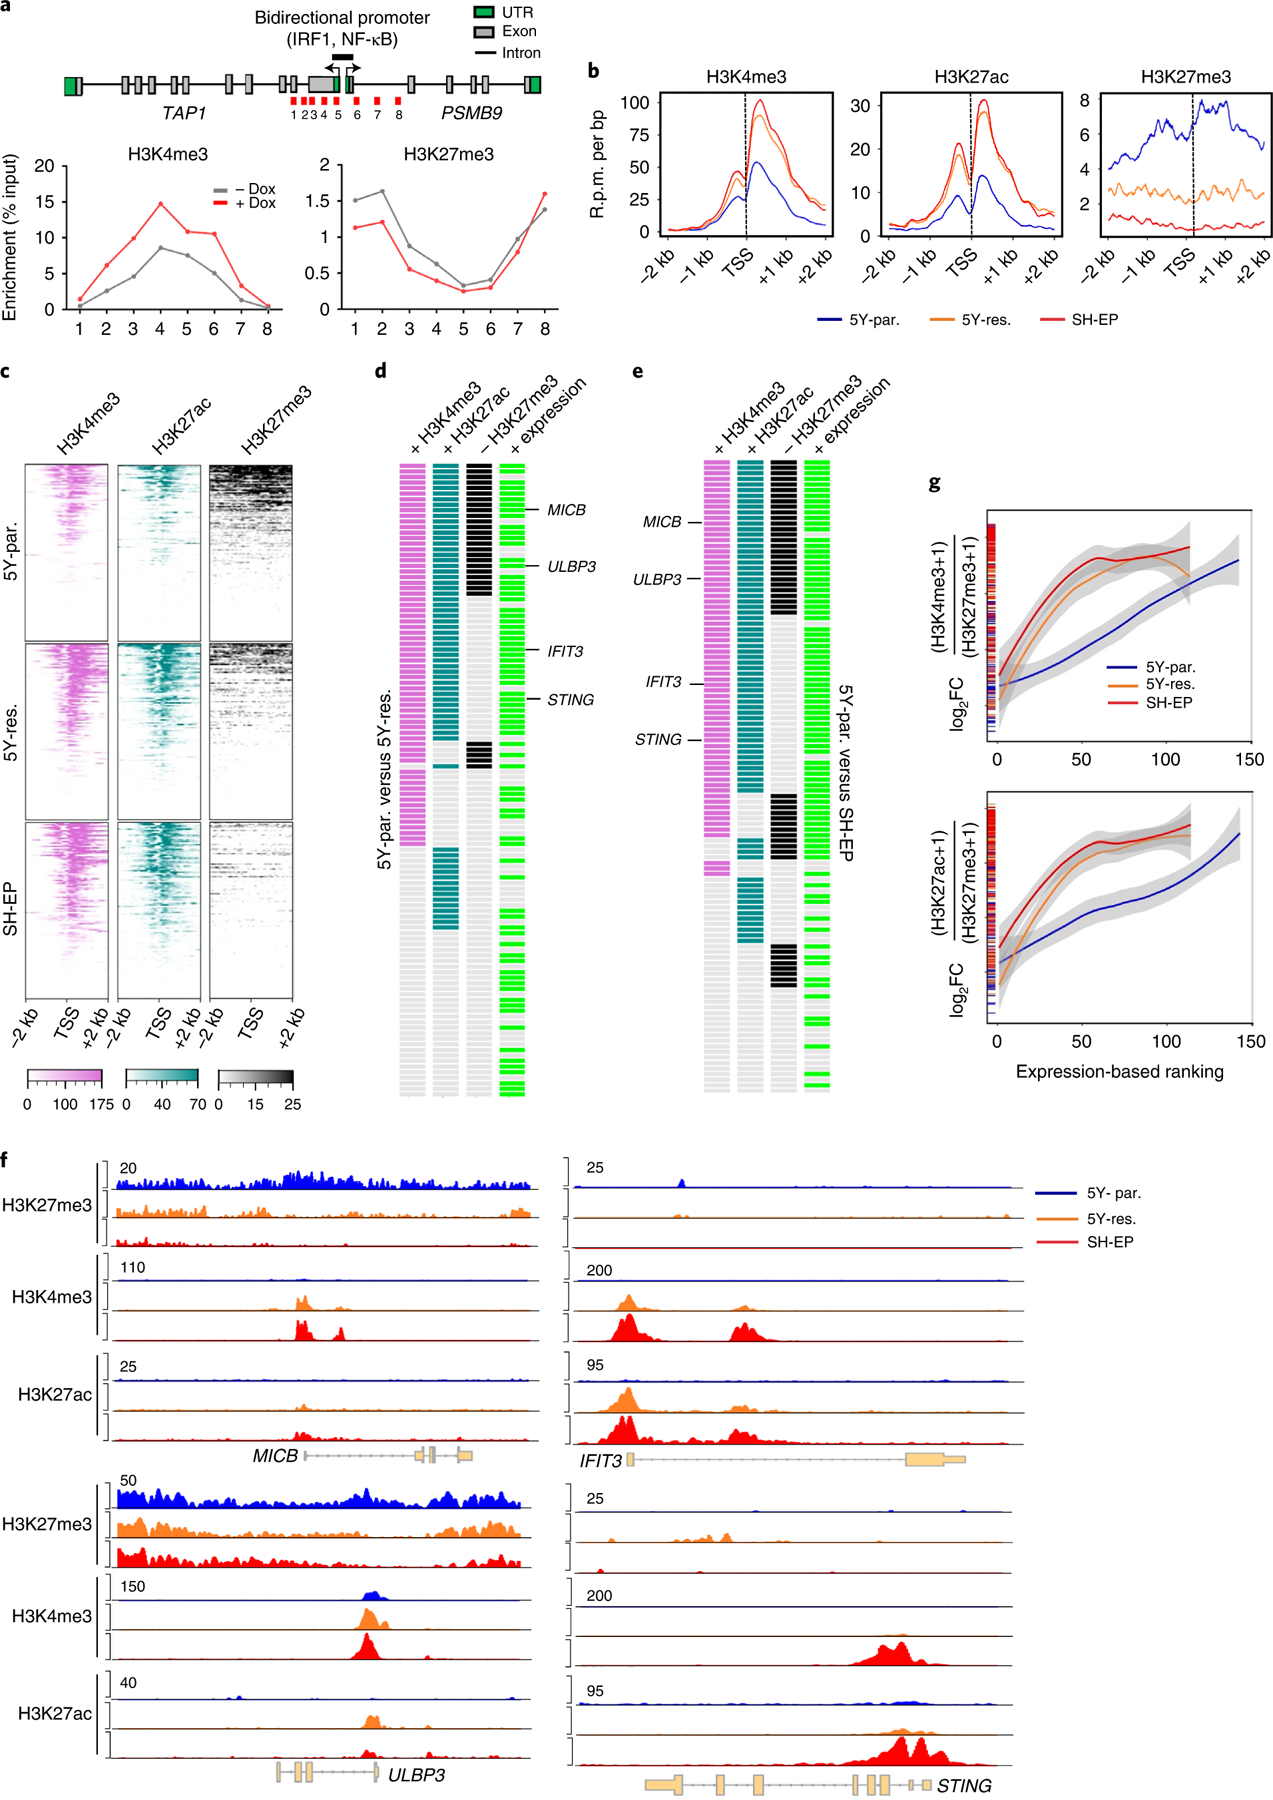
Fig. 4 |. Activation of immune gene expression associated with cell state transition is epigenetically regulated.

a, Upper: linear representation of TAP1 and PSMB9 gene loci showing the locations of the bidirectional promoter and IRF1 and NF-κB binding sites. Lower: ChIP–qPCR analysis of H3K4me3 and H3K27me3 enrichment at the indicated amplicons (1–8, shown in red in upper) in SH-SY5Y cells expressing dox-inducible PRRX1 in the presence or absence of dox (200 ng ml−1) for 10 days. Data points represent mean of two technical replicates of two independent experiments. b, Metagene representations of average ChIP–seq occupancies of the indicated histone marks at the promoters of tumor cell-intrinsic immune genes (TSS ± 2 kb) in 5Y-par. (n = 143 genes), 5Y-res. (n = 114 genes) and SH-EP cells (n = 114 genes). c, Heat map of histone enrichment at the same immune gene promoters as in b, ranked in decreasing order of occupancy in the indicated cells. Each row represents the normalized densities of histone marks within a ±2 kb window centered on the TSS. d,e, Representation of pair-wise comparisons between 5Y-par. and 5Y-res. cells (d), and 5Y-par. and SH-EP cells (e). The changes (+, gained; −, lost) in occupancies of the active (H3K4me3, H3K27ac) and repressive (H3K27me3) histone marks (log2FC ≥ 0.75, TSS ± 2 kb), together with the corresponding changes in RNA expression (+, overexpressed; log2FC ≥ 1) of each of the tumor cell-intrinsic immune genes analyzed in b, are shown. f, ChIP–seq tracks depicting the gain of active histone binding together with the loss of repressive histone binding at MICB and ULBP3 gene loci (left) or gain of active marks without changes in repressive mark occupancy at IFIT3 and STING loci (right). Signal intensity is given at the top left corner of each track. g, Loess regression analysis of the correlation between the ratios of active to repressive histone binding at the promoters of immune response genes and their RNA expression. Genes are ranked based on increasing expression. Shaded regions represent 95% confidence intervals. UTR, untranslated region.
