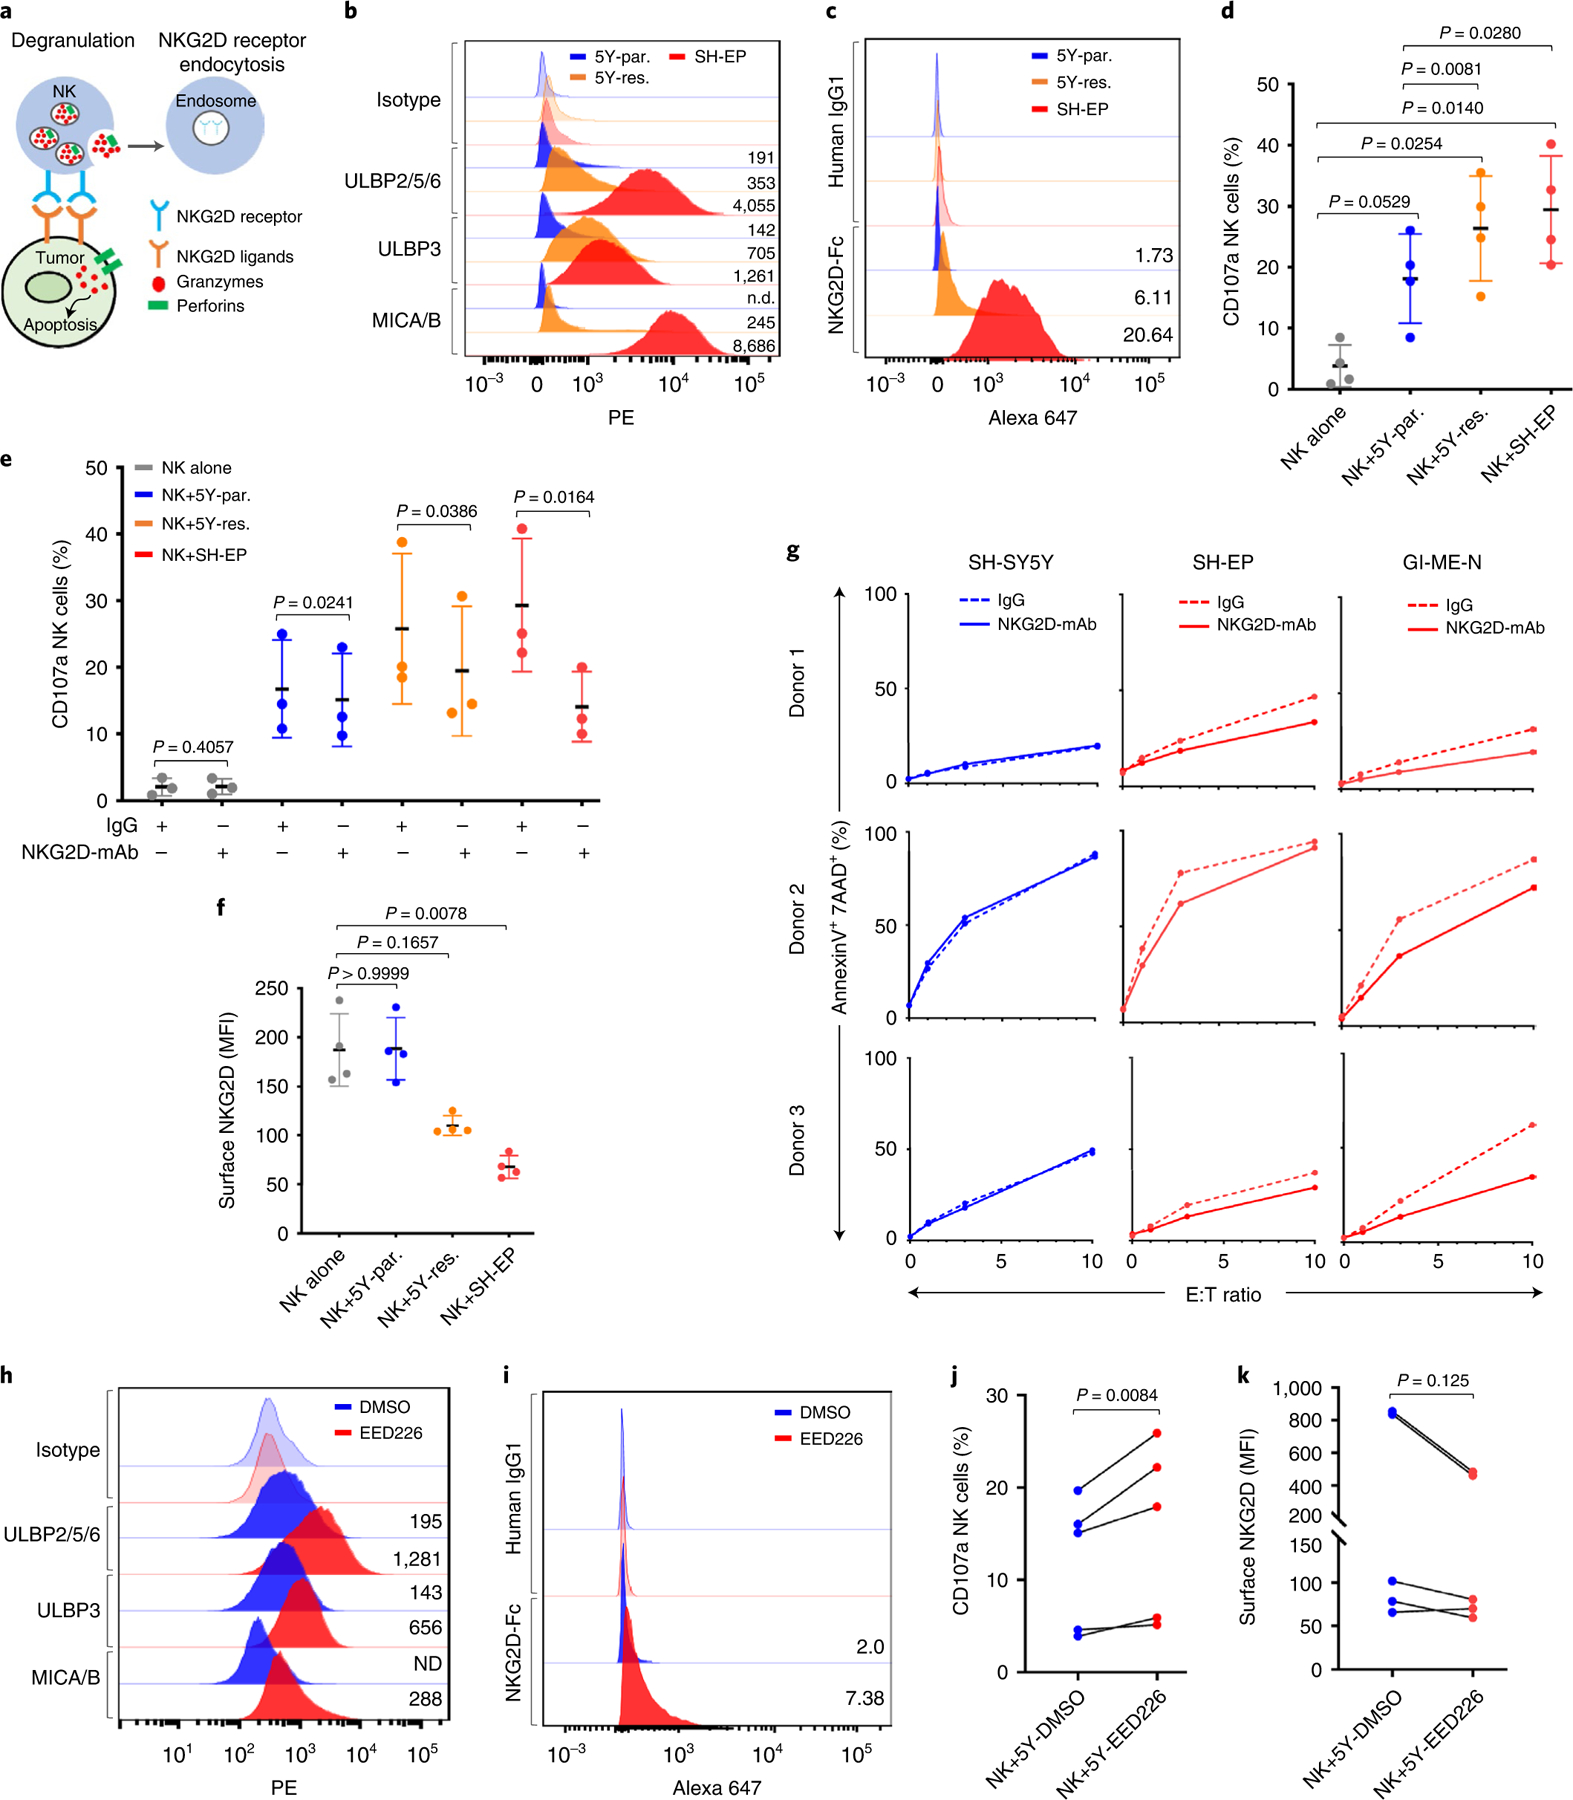
Fig. 5 |. Mesenchymal NB cells induce NKG2D-dependent NK activation.

a, Schematic interaction between NKG2D receptors and cognate ligands, leading to NK cell degranulation and receptor endocytosis. b, FACS analysis of NKG2D ligands in the indicated cells. Plots are representative of four independent experiments; numbers indicate isotype-normalized gMFI. c, FACS analysis of recombinant NKG2D-Fc or IgG1 binding in the indicated cells. Numbers denote fold-change in Alexa-647 median fluorescent intensity (MFI) (NKG2D-Fc/IgG1) (n = 3 independent experiments, P = 0.0040, one-way ANOVA followed by test for linear trend). d, Dot plot quantifying degranulation in naïve NK cells (NK alone) or following coculture with indicated targets. Data represent mean ± s.d., four independent experiments. Significance was calculated using repeated measures (RM) one-way ANOVA with the Geisser–Greenhouse correction followed by Sidak’s multiple comparisons test. e, Dot plot quantifying the effect of control IgG1 or NKG2D blocking antibody on NK cell degranulation following coculture with the indicated targets. Data represent mean ± s.d., three independent experiments. Significance was calculated using the two-tailed ratio paired t-test. f, Dot plot quantifying NKG2D MFI in NK cells following coculture with the indicated targets. Data represent means ± s.d., four independent experiments. Significance was calculated using Friedman test followed by Dunn’s multiple comparisons test. g, X–Y plots of NK cell cytotoxicity with control IgG1 or anti-NKG2D antibody against the indicated targets. Data represent three independent experiments. h, FACS analysis of NKG2D ligands in SH-SY5Y cells treated with DMSO or EED226 (5 µM for 8 d). Plots are representative of two independent experiments. Numbers indicate isotype-normalized gMFI. i, FACS analysis of NKG2D-Fc or IgG1 binding in SH-SY5Y cells treated with either DMSO or EED226 as in f. Numbers indicate fold-change in Alexa-647 MFI (NKG2D-Fc/IgG1) (n = 3 independent experiments, P = 0.0060, two-tailed paired t-test). j,k, Before–after plots of degranulation (j) and NKG2D MFI (k) following coculture of naïve NK cells with SH-SY5Y cells treated with DMSO or EED226. Data in j and k represent five independent experiments. Significance in j was derived using the two-tailed ratio paired t-test and in k using the two-tailed Wilcoxon matched-pairs signed rank test. DMSO, dimethylsulfoxide; ND, not determined; PE, phycoerythrin.
