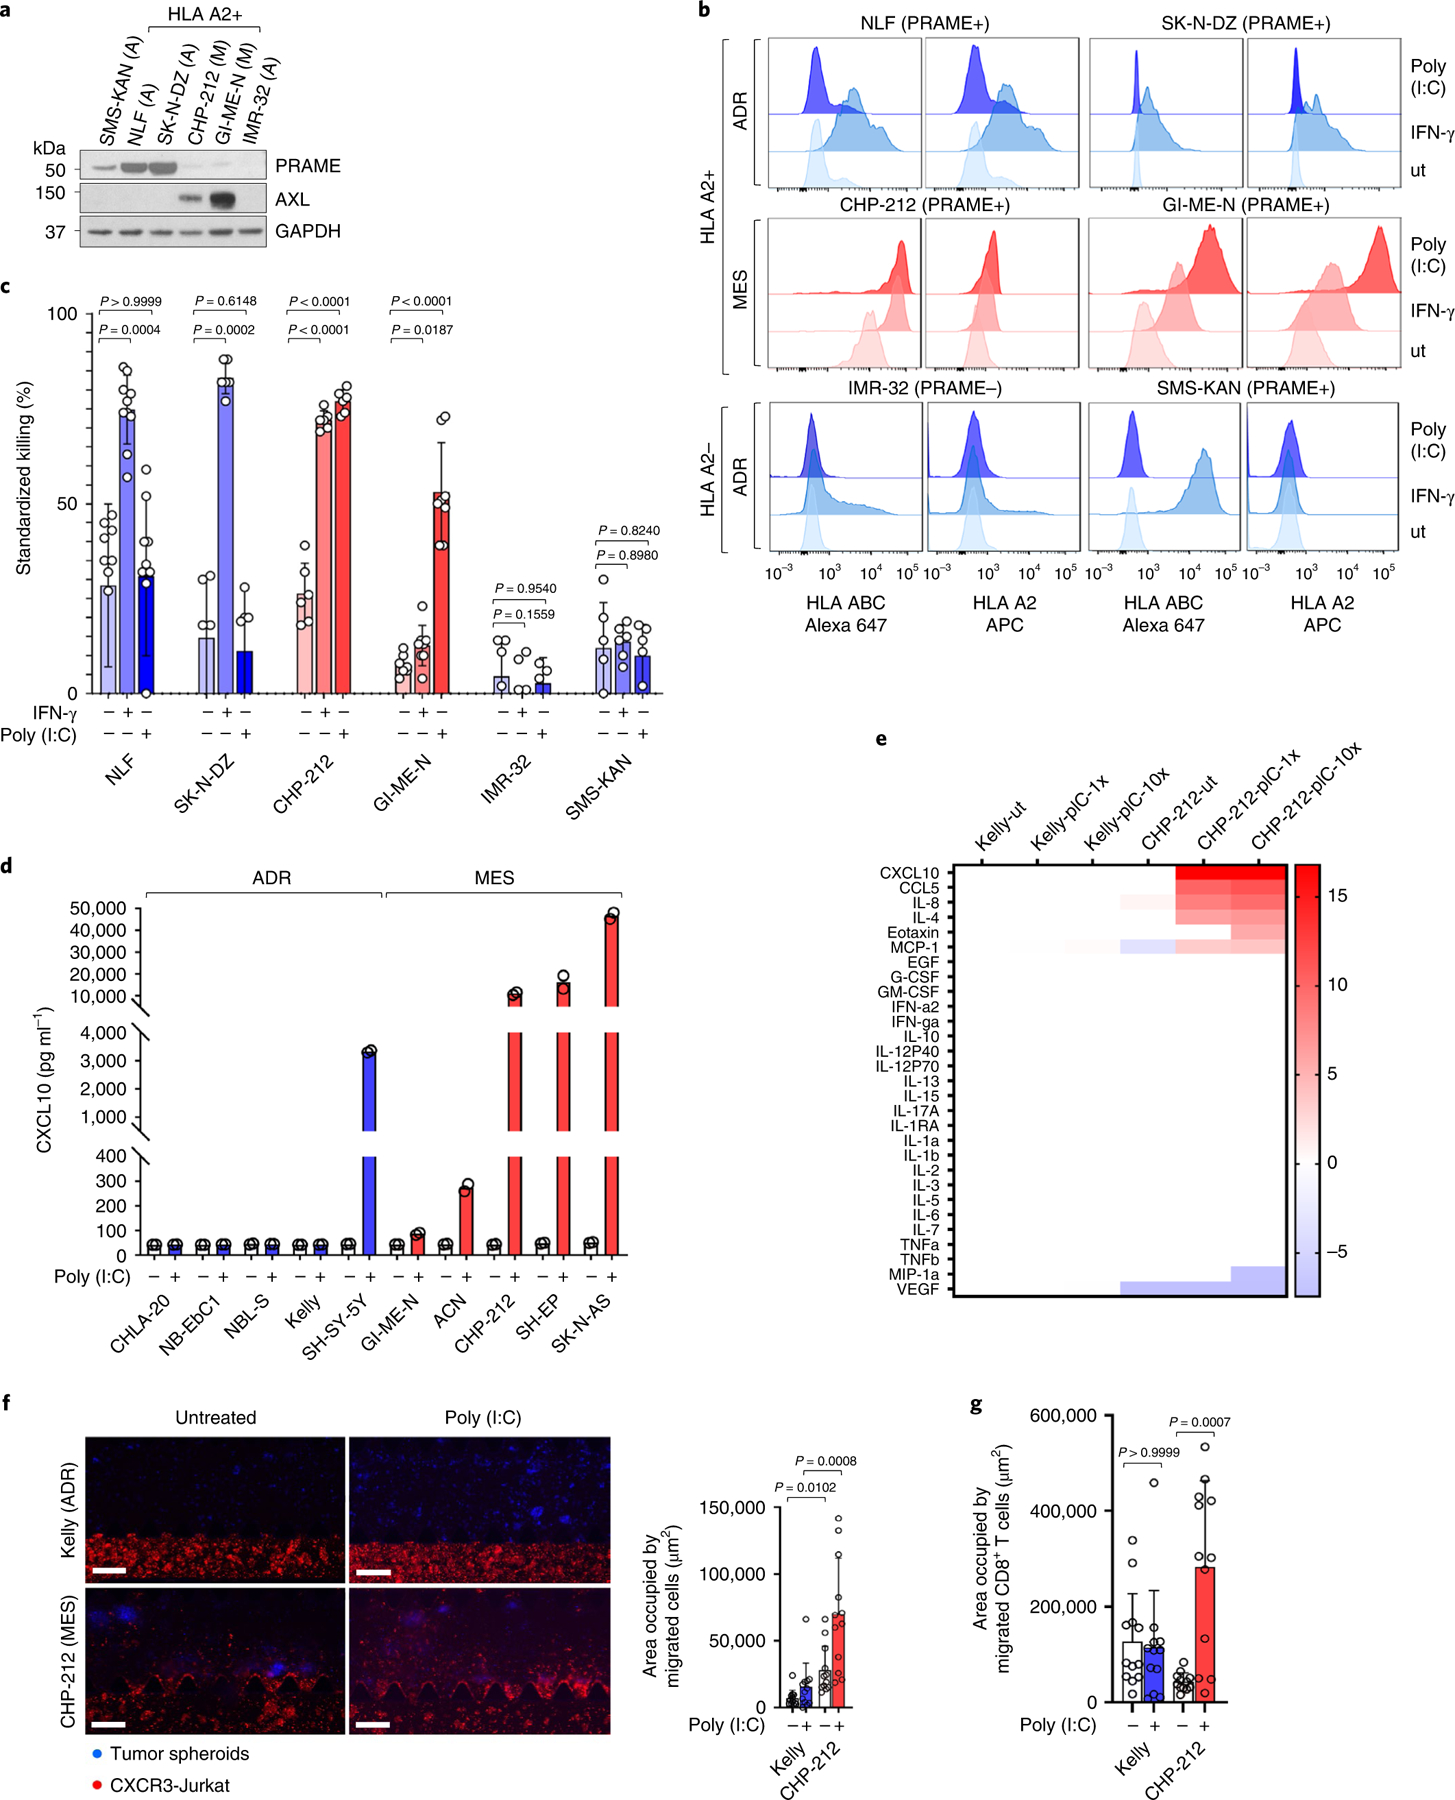
Fig. 6 |. Mesenchymal NB cells are killed by antigen-specific CTLs.

a, WB analysis of PRAME and AXL in the indicated adrenergic (A) or mesenchymal (M) NB cells. GAPDH, loading control. b, FACS analysis of HLA subtypes in the indicated cells, untreated (ut) or following IFN-γ or poly(I:C). Data (a, b) are representative of two independent experiments. c, Bar graphs quantifying cytotoxicity of PRAME-specific CTLs against neuroblastoma cells following IFN-γ (100 U ml−1) or poly(I:C) (10 µg ml−1) × 24 h and coculture at an E:T ratio of 10:1. Data represent mean ± s.d. of n = 10 (NLF), n = 6 (SK-N-DZ, CHP-212,SMS-KAN) and n = 8 (GI-ME-N) independent experiments for all conditions, and n = 6 (untreated and IFN-γ) and n = 4 (poly(I:C)) independent experiments in IMR-32 cells. Significance was derived using the Friedman test followed by Dunn’s multiple comparisons test (NLF); mixed-effects analysis followed by Sidak’s multiple comparisons test (IMR-32); and repeated-measures one-way ANOVA and Geisser–Greenhouse correction followed by Sidak’s multiple comparisons test (SK-N-DZ, CHP-212, GI-ME-N, SMS-KAN). d, ELISA analysis of CXCL10 in conditioned media from the indicated neuroblastoma cells ± poly(I:C) (1 µg ml−1) for 24 h. Data represent mean of two independent experiments, P = 0.0485, Kruskal–Wallis test followed by Dunn’s multiple comparisons test. e, Heat map of log2FCs in the expression of the indicated proteins in conditioned media from adrenergic Kelly or mesenchymal CHP-212 cells, untreated (ut) or treated with 1 or 10 µg ml−1 poly(I:C) (pIC-1x or pIC-10x) × 24 h, and analyzed using multiplex cytokine profiling. Data were normalized to the Kelly-ut sample. f, Left: immunofluorescence images of CXCR3-Jurkat cell migration toward Kelly or CHP-212 spheroids grown in a 3D microfluidic device ± poly(I:C). Scale bar, 200 µm. Right: quantification of area occupied by migrated cells. Data represent mean ± s.d., 12 regions of interest (ROIs) per condition, significance derived using Kruskal–Wallis test followed by Dunn’s multiple comparisons test. g, Quantification of area occupied by CD8+ T cells migrating toward the tumor spheroids in f. Data represent means ± s.d., 12 ROIs per condition. Significance was calculated as in f. Data in f and g are representative of two independent experiments each.
