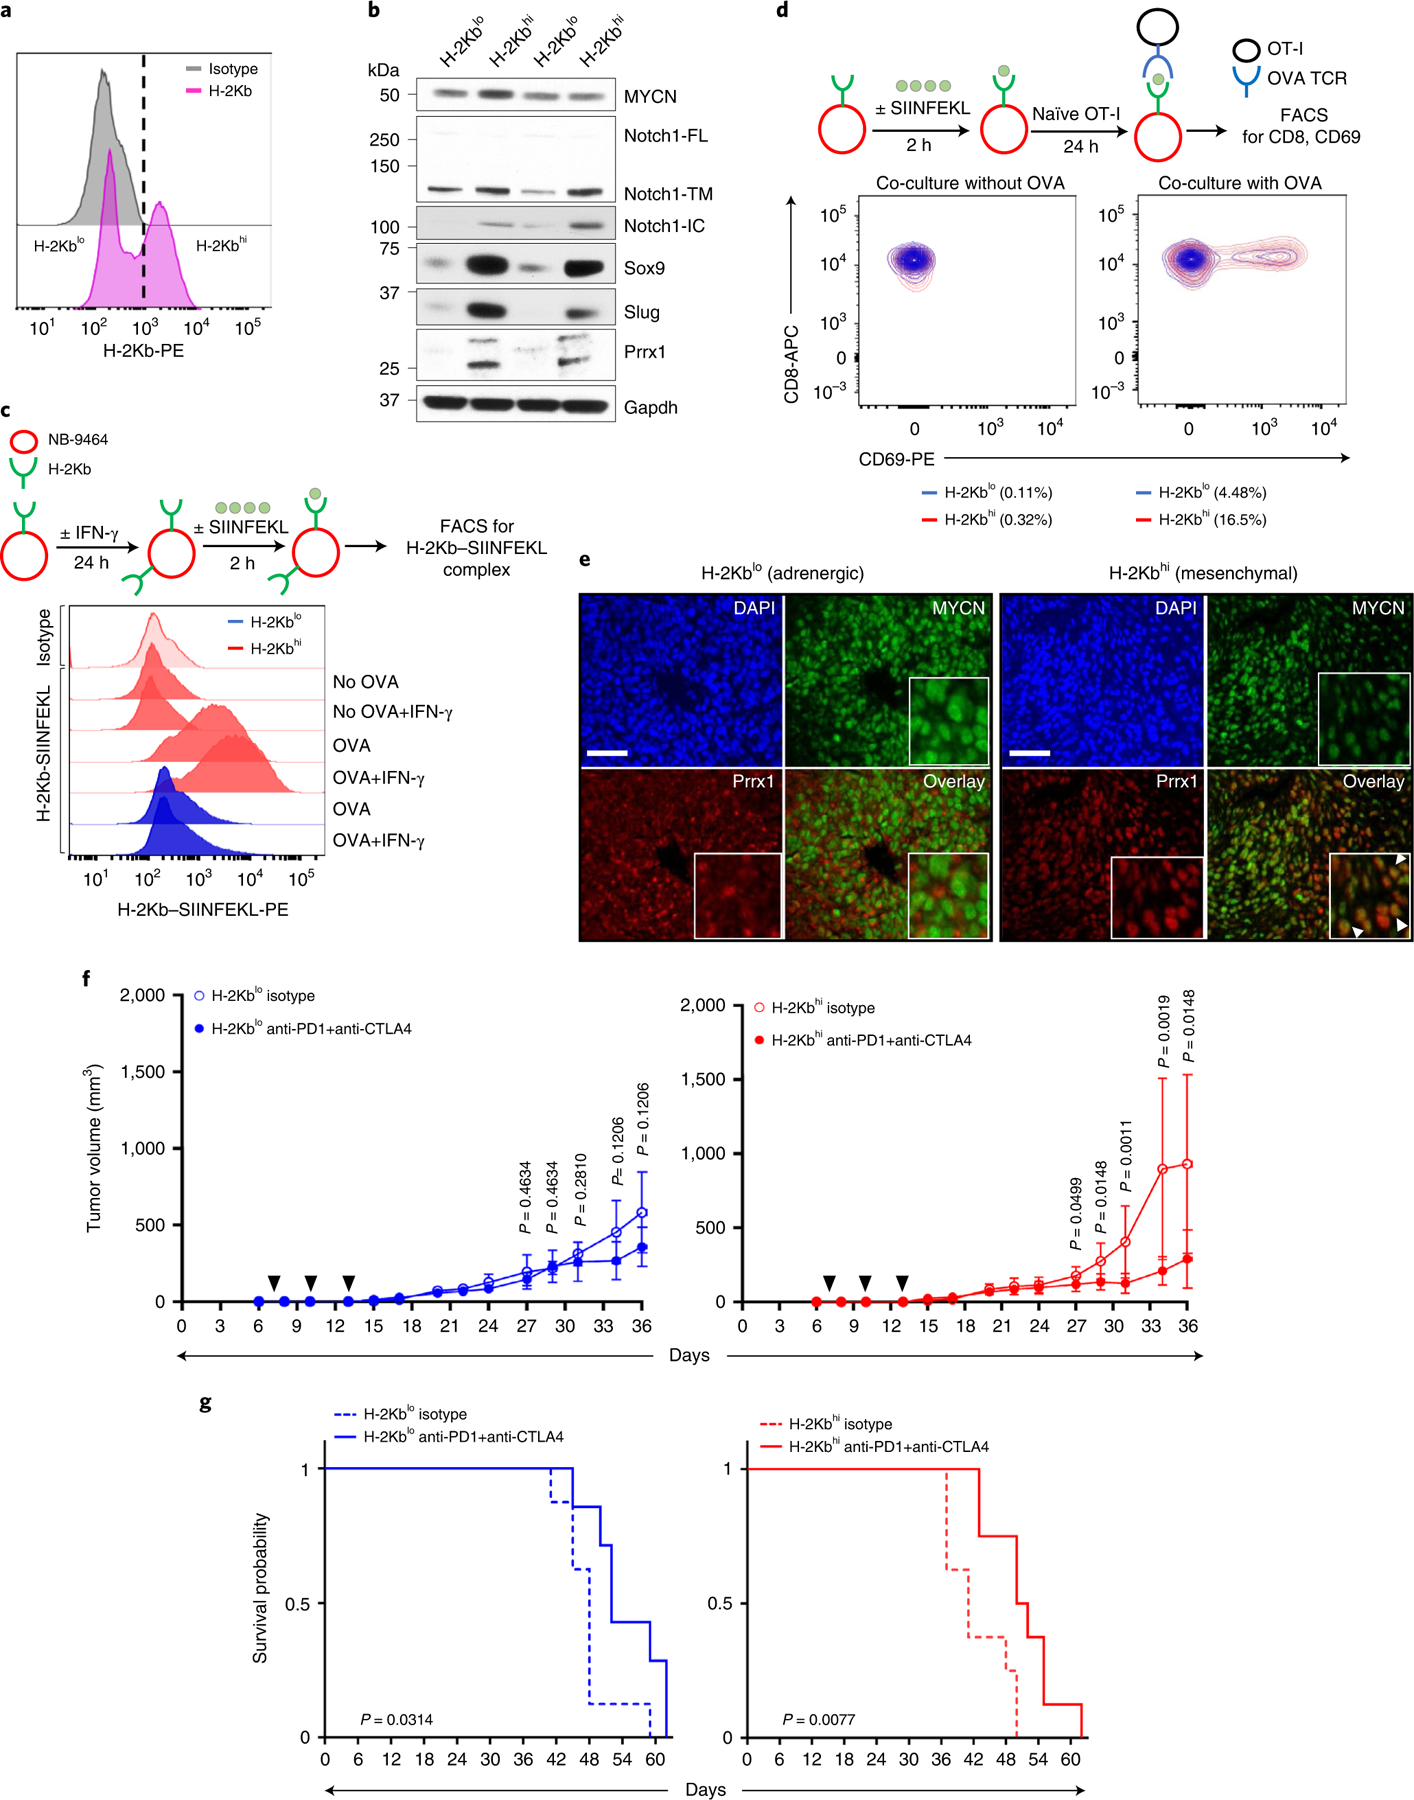
Fig. 7 |. Mesenchymal NB cells functionally engage with cytotoxic T cells and are responsive to ICB.

a, FACS analysis of H-2Kb expression in NB-9464 cells. The vertical dashed line denotes the logscale expression value used to gate H-2Kblo and H-2Kbhi populations. Data are representative of two independent experiments. b, WB analysis of lineage markers in H-2Kblo and H-2Kbhi cell populations. n = 2 independent experiments. Notch1-FL, full length; -TM, transmembrane; -IC, intracellular. GAPDH, loading control. c, Upper: schematic of OVA binding assay. Lower: FACS analysis of H-2Kb–SIINFEKL complex in H-2Kbhi and H-2Kblo cells at baseline or following IFN-γ (100 ng ml−1 × 24 h) ± OVA peptide. Data are representative of one independent experiment. d, Upper: schematic of NB-9464-OT-I coculture assay. Lower: contour plots showing the percentage of naïve OT-I cells that were activated (CD8+ CD69+) following coculture with H-2Kblo and H-2Kbhi cells for 24 h with or without the OVA peptide. Data are representative of one independent experiment. e, Immunofluorescence images of MYCN and Prrx1 expression in murine tumors derived from H-2Kblo and H-2Kbhi cells. Nuclei are counterstained with DAPI. Insets: nuclear costaining of MYCN and Prrx1 (arrowheads). Scale bar, 100 µm. Data are representative of n = 3 tumors for each group. f, Tumor volumes in C57BL/6 mice injected subcutaneously with 1 × 10⁶ H-2Kblo or H-2Kbhi cells and treated with anti-PD1 + anti-CTLA4 antibodies or isotype control on days 7, 10 and 13 after tumor inoculation (black arrowheads). Data represent mean ± s.d. n = 8 (H-2Kblo isotype); n = 7 (H-2Kblo anti-PD1 + anti-CTLA4); n = 8 (H-2Kbhi isotype); n = 8 (H-2Kbhi anti-PD1 + anti-CTLA4) mice per group across all time points. Significance was calculated using the two-tailed Mann–Whitney test. g, Kaplan–Meier analysis of mice bearing H-2Kblo or H-2Kbhi tumors treated with isotype or anti-PD1 + anti-CTLA4 antibodies as in f. Significance was determined by the log-rank test.
