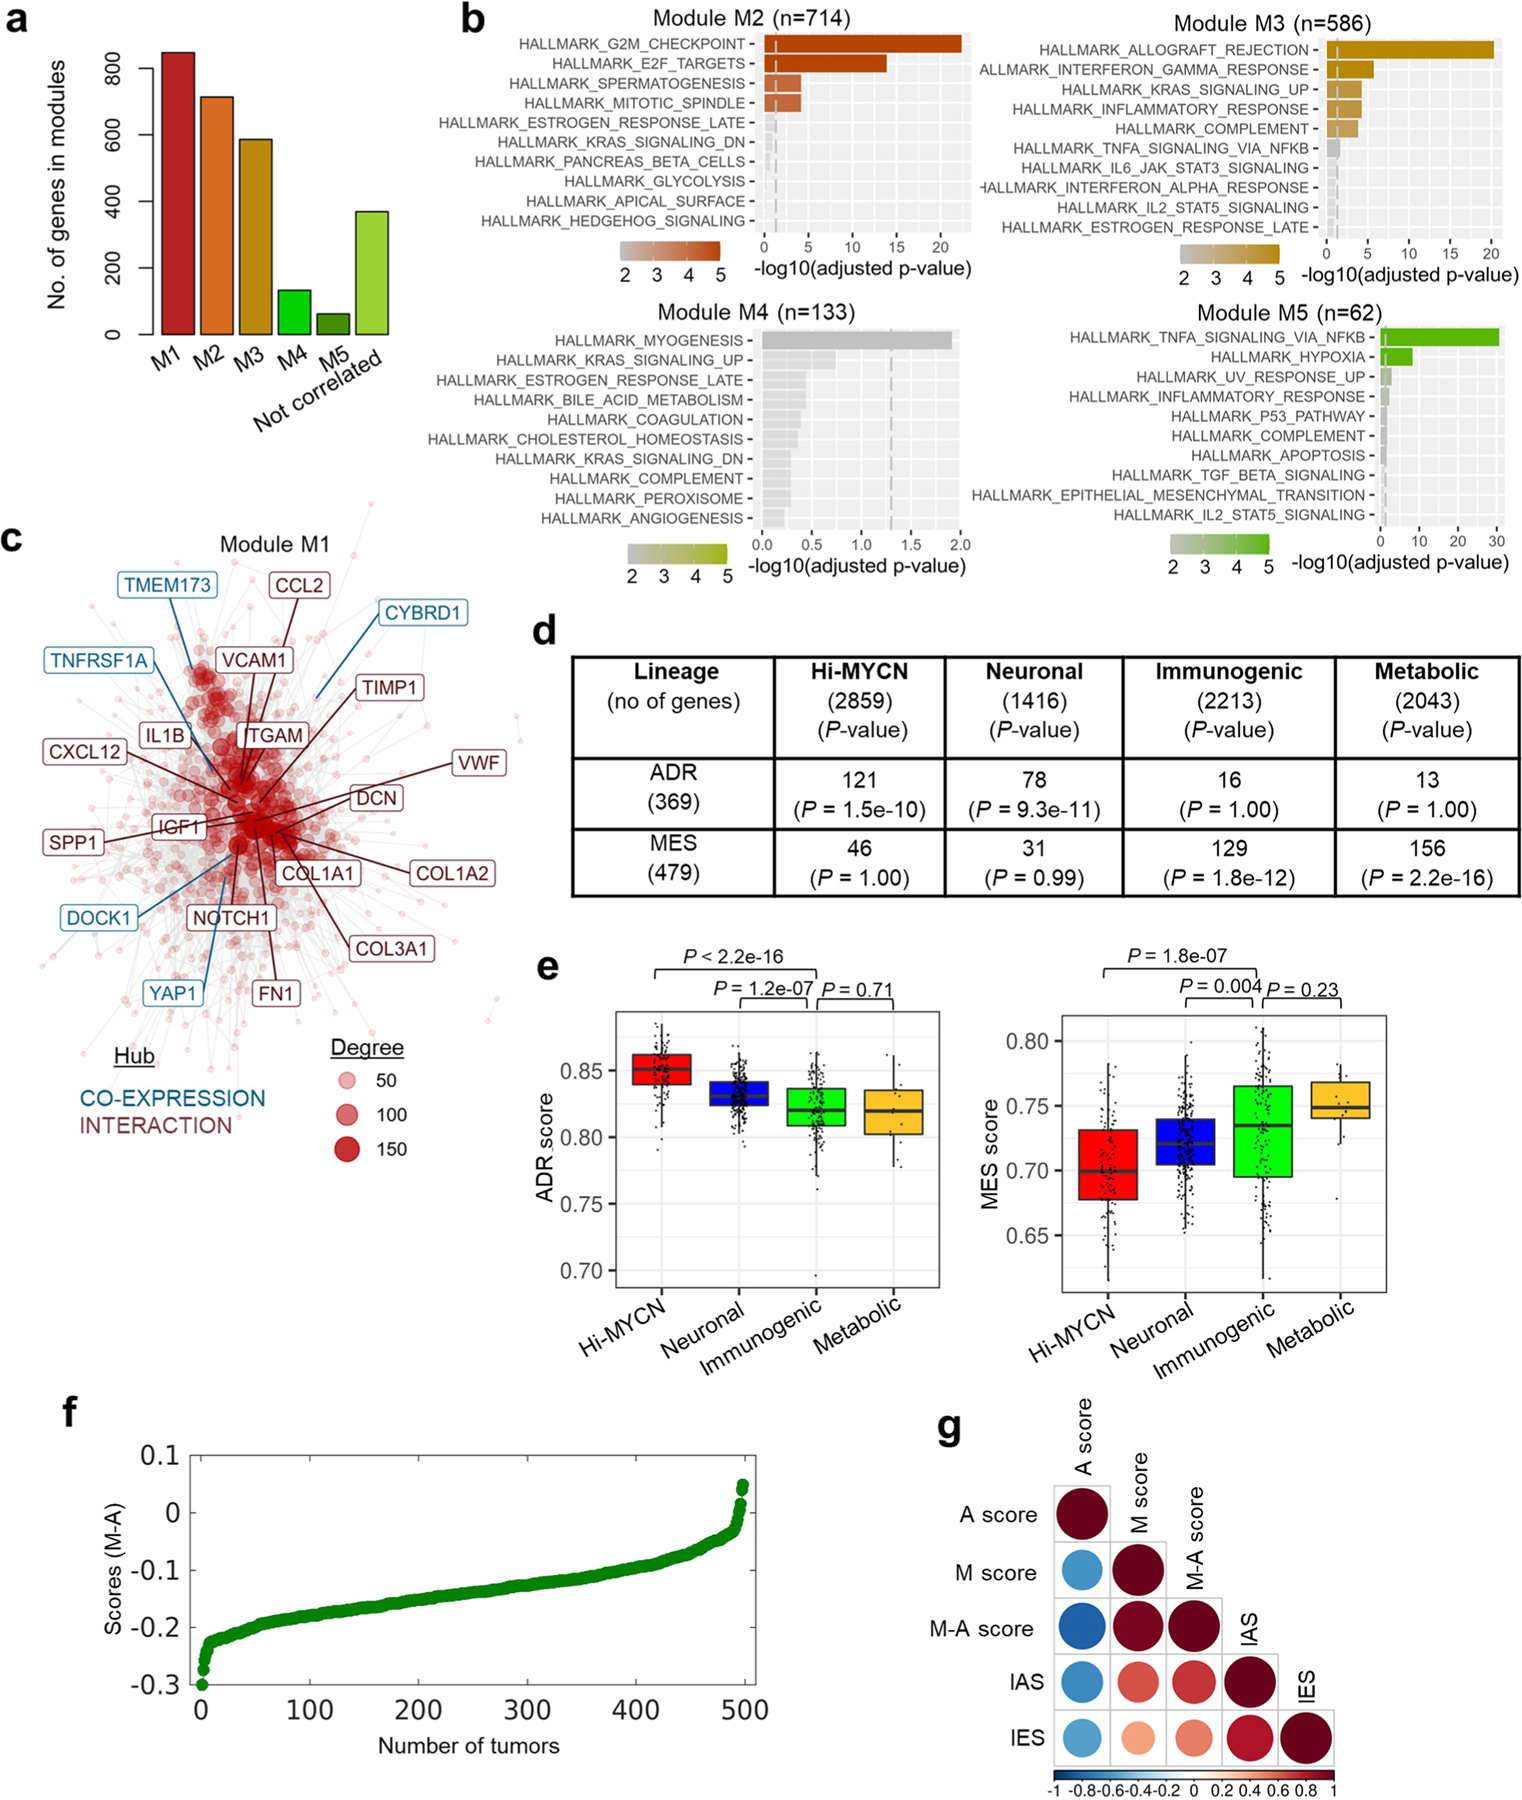
Extended Data Fig. 2 |. Cell lineage is significantly associated with immune gene signatures in NB.

a, Bar plots representing the numbers of co-expressed genes within each module. b, GO analysis of co-expressed genes associated with indicated modules (KEGG database). The vertical dashed lines indicate the adjusted P-value of 0.05, two-tailed hypergeometric test. c, Gene network representing all possible interactions in module M1. The topmost connected genes (hubs) are indicated. Hubs derived from module M1 are colored blue (co-expression) and those from the STRING database are indicated in red (interaction). The size of each node corresponds to the degree of interaction. d, Summary of the overlap between the DEGs associated with the four tumor clusters and the adrenergic or mesenchymal signature genes as per Groningen et al., 201738. Significance determined by two-tailed Fisher’s exact test. e, Box plots comparing the expression of adrenergic and mesenchymal scores within the four clusters (n = 498 tumors [Hi-MYCN (n = 103), neuronal (241), immunogenic (140), metabolic (14)] derived from the SEQC-498 tumor data set. All box plots are defined by center lines (medians), box limits (25th and 75th percentiles) and whiskers (minima and maxima; the smallest and largest data range). The immunogenic cluster was compared with the other three clusters and significance determined by the two-tailed Wilcoxon rank-sum test. f, Scatter plot of the 498 primary NB tumors ranked based on increasing M-A scores. g, Pearson correlation matrix showing pairwise correlation values among the indicated parameters. The colors and sizes of the circles indicate the correlation coefficient values, with the least (smaller blue circles) to the most (larger brown circles) degree of association between the parameters shown.
