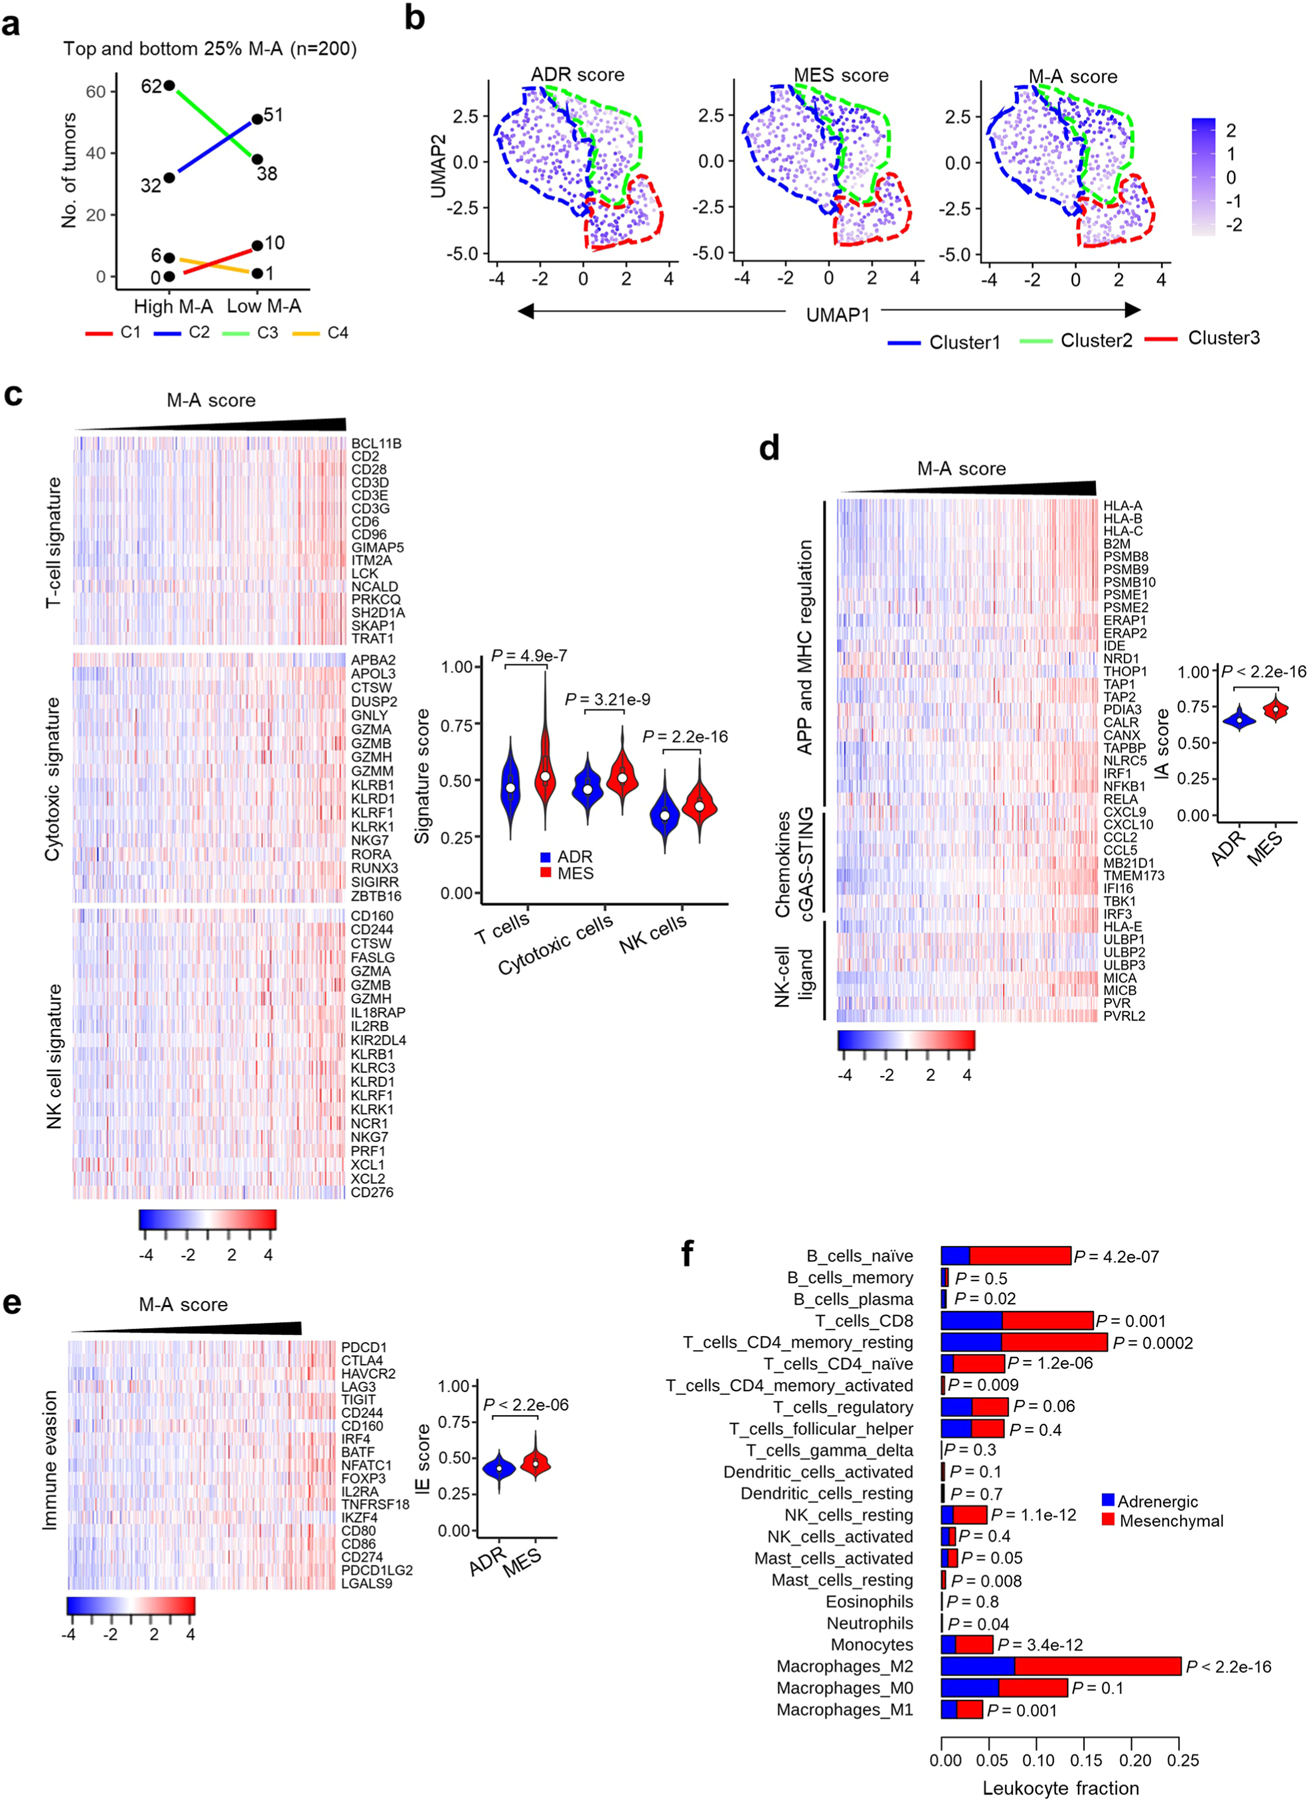
Extended Data Fig. 3 |. The relative mesenchymal score (M-A score) is positively correlated with an immunogenic signature.

a, Dot plots showing the distribution of MYCN-nonamplified tumors (n = 400) within each of the clusters based on ranked M-A scores. Tumors from the upper (high M-A) and lower (low M-A) M-A score quartiles are shown (n = 200 tumors; P = 0.0011 for C3). Statistical significance assessed by the two-tailed Fisher’s exact test. b, UMAP visualization of the distribution of adrenergic, mesenchymal, and M-A scores among the three tumor clusters derived from 394 NBs in the GSE120572 dataset. Color bar represents normalized z-scores. Values <2.5 and >2.5 were set to −2.5 and +2.5, respectively, to reduce the effects of extreme outliers. c, Left, Heat map of the indicated immune cell signatures in MYCN-nonamplified tumors (n = 401), ranked by increasing M-A scores. Log2 gene expression values were z-score transformed for heat map visualization. Right, violin plots comparing the quantitative scores of the indicated immune cell signatures in 100 tumors each from the upper (mesenchymal) and lower (adrenergic) quartiles of the tumor M-A scores using the two-sided K-S test. Box plots within the violin plots are defined by center lines (medians), box limits (25th and 75th percentiles) and whiskers (minima and maxima; 1.5X the interquartile range). d, e, Heat maps depicting IA (d) and IE (e) signatures in MYCN-nonamplified tumors, ranked by increasing M-A score. Log2 gene expression values were z-score transformed for visualization. Violin plots comparing the distribution of IA (d) and IE (e) signatures in 100 tumors each from upper (mesenchymal) and lower (adrenergic) quartiles of the tumor M-A scores are shown next to the heat maps. Significance determined by the two-sided K-S test. Box plots within the violin plots are defined as in (c). f, Bar diagram comparing the CIBERSORT-estimated fractional content of the indicated tumor-infiltrating leukocytes between MYCN-nonamplified adrenergic and mesenchymal tumors. Adrenergic and mesenchymal tumors were assigned as in (c). Data represent the mean, n = 100 tumors, P determined by the two-tailed Welch’s t-test.
