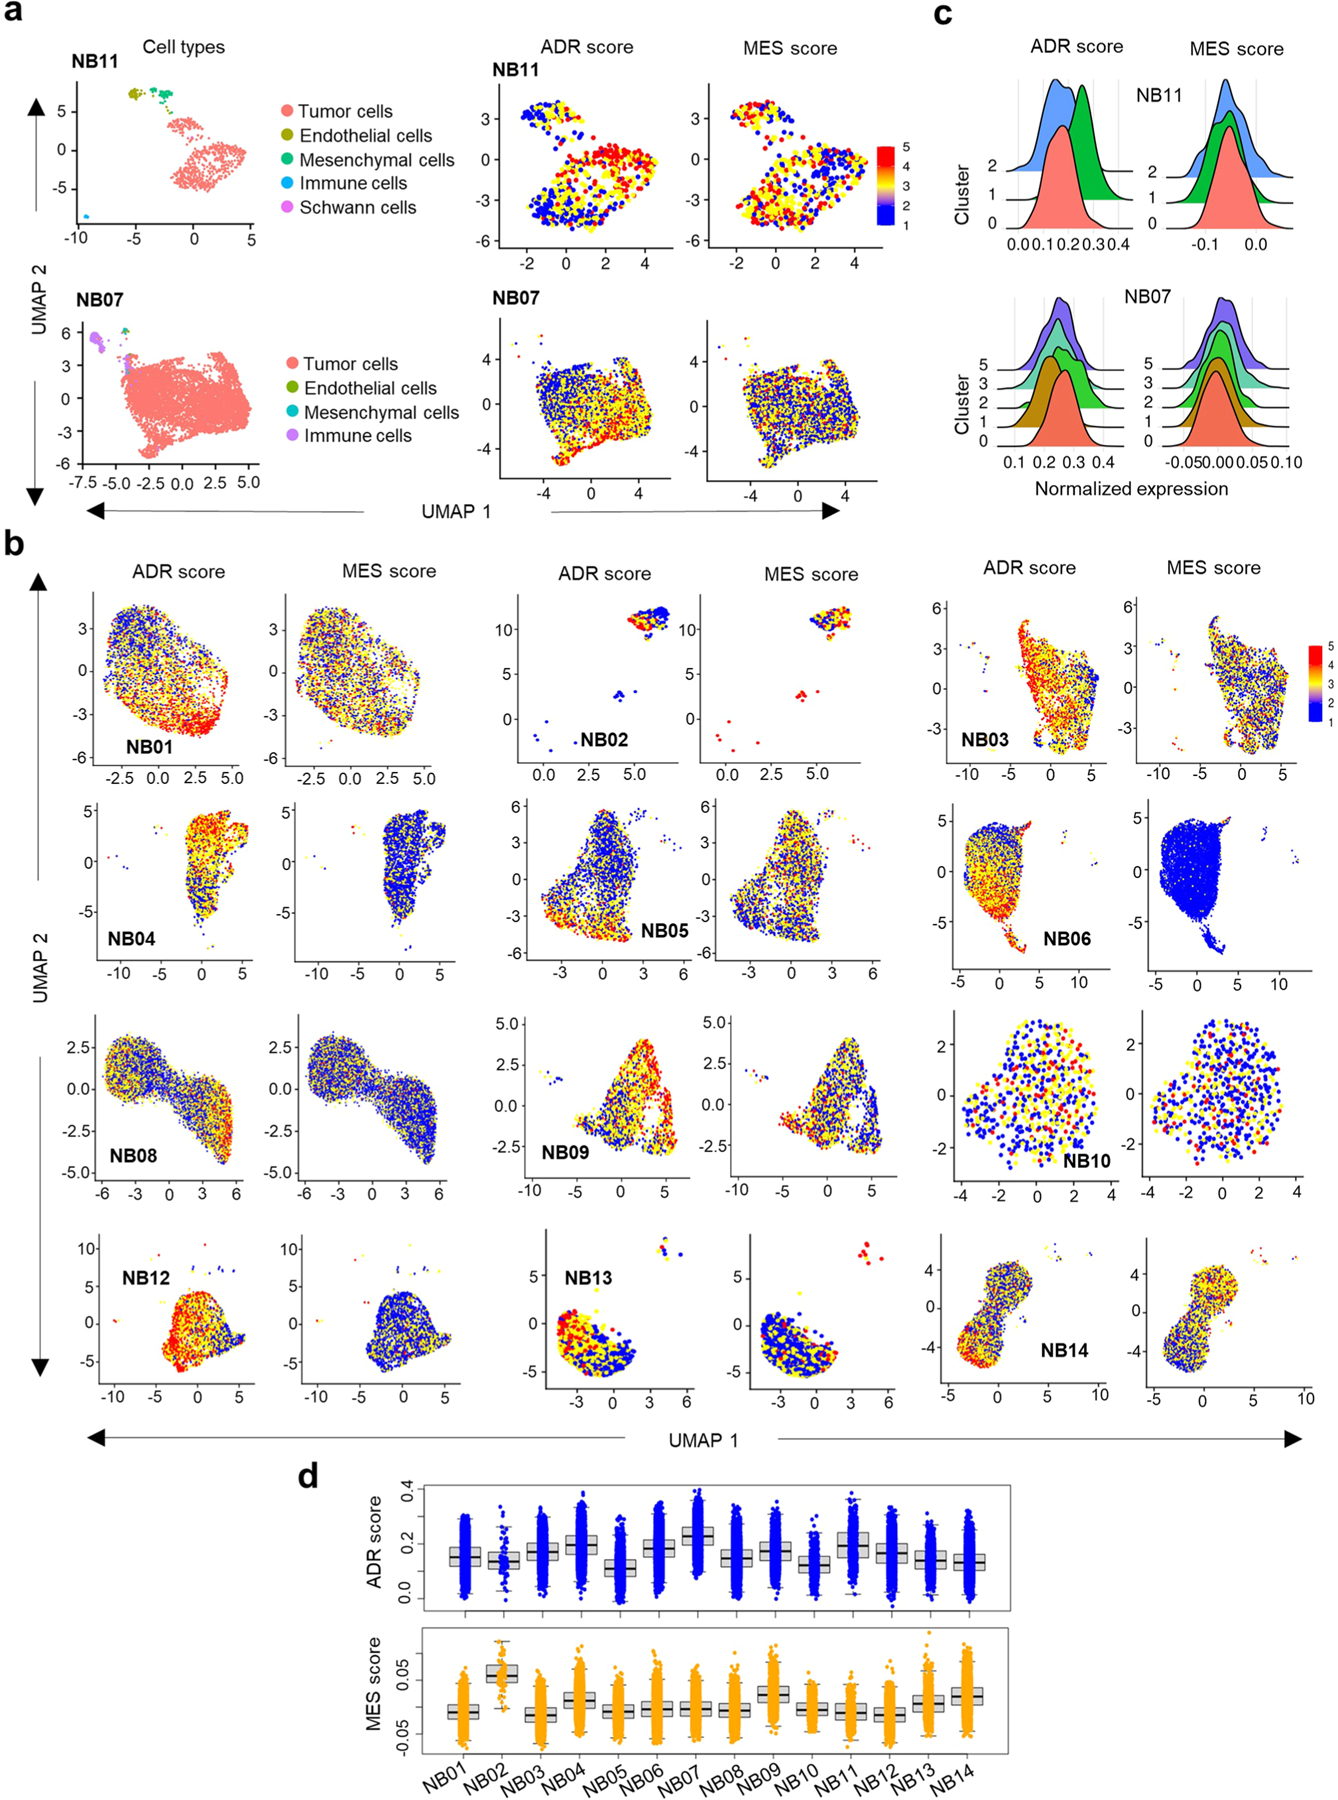
Extended Data Fig. 4 |. Cellular heterogeneity predicts immune gene expression in NB tumors.

a, UMAP embedding of 691 (top left) and 6498 (bottom left) cell signatures derived from two representative MYCN-amplified and nonamplified tumors (NB11 and NB07), respectively. Clusters of transcriptionally similar cells are colored by cell type. UMAP representation of 573 (top right) and 6299 (bottom right) malignant cell signatures from the same samples as in left panel. b, UMAP representation of the distribution of malignant cells in 12 NB tumors. Cells are colored based on the score calculated from the average expression of genes per cell38. c, Ridge plot representing the distributions of the ADR and MES scores of the malignant cells within the indicated clusters. d, Box plot representing ADR and MES scores of 56,597 malignant cells from 14 primary NB tumor samples based on transcriptional diversity (n = 4543 cells in NB01, 66 in NB02, 4429 in NB03, 3914 in NB04, 3769 in NB05, 7782 in NB06, 6047 in NB07, 10675 in NB08, 2353 in NB09, 587 in NB10, 568 in NB11, 3596 in NB12, 1024 in NB13 and 7244 in NB14). Box plots are defined by center lines (medians), box limits (25th and 75th percentiles) and whiskers (minima and maxima; 1.5X the interquartile range).
