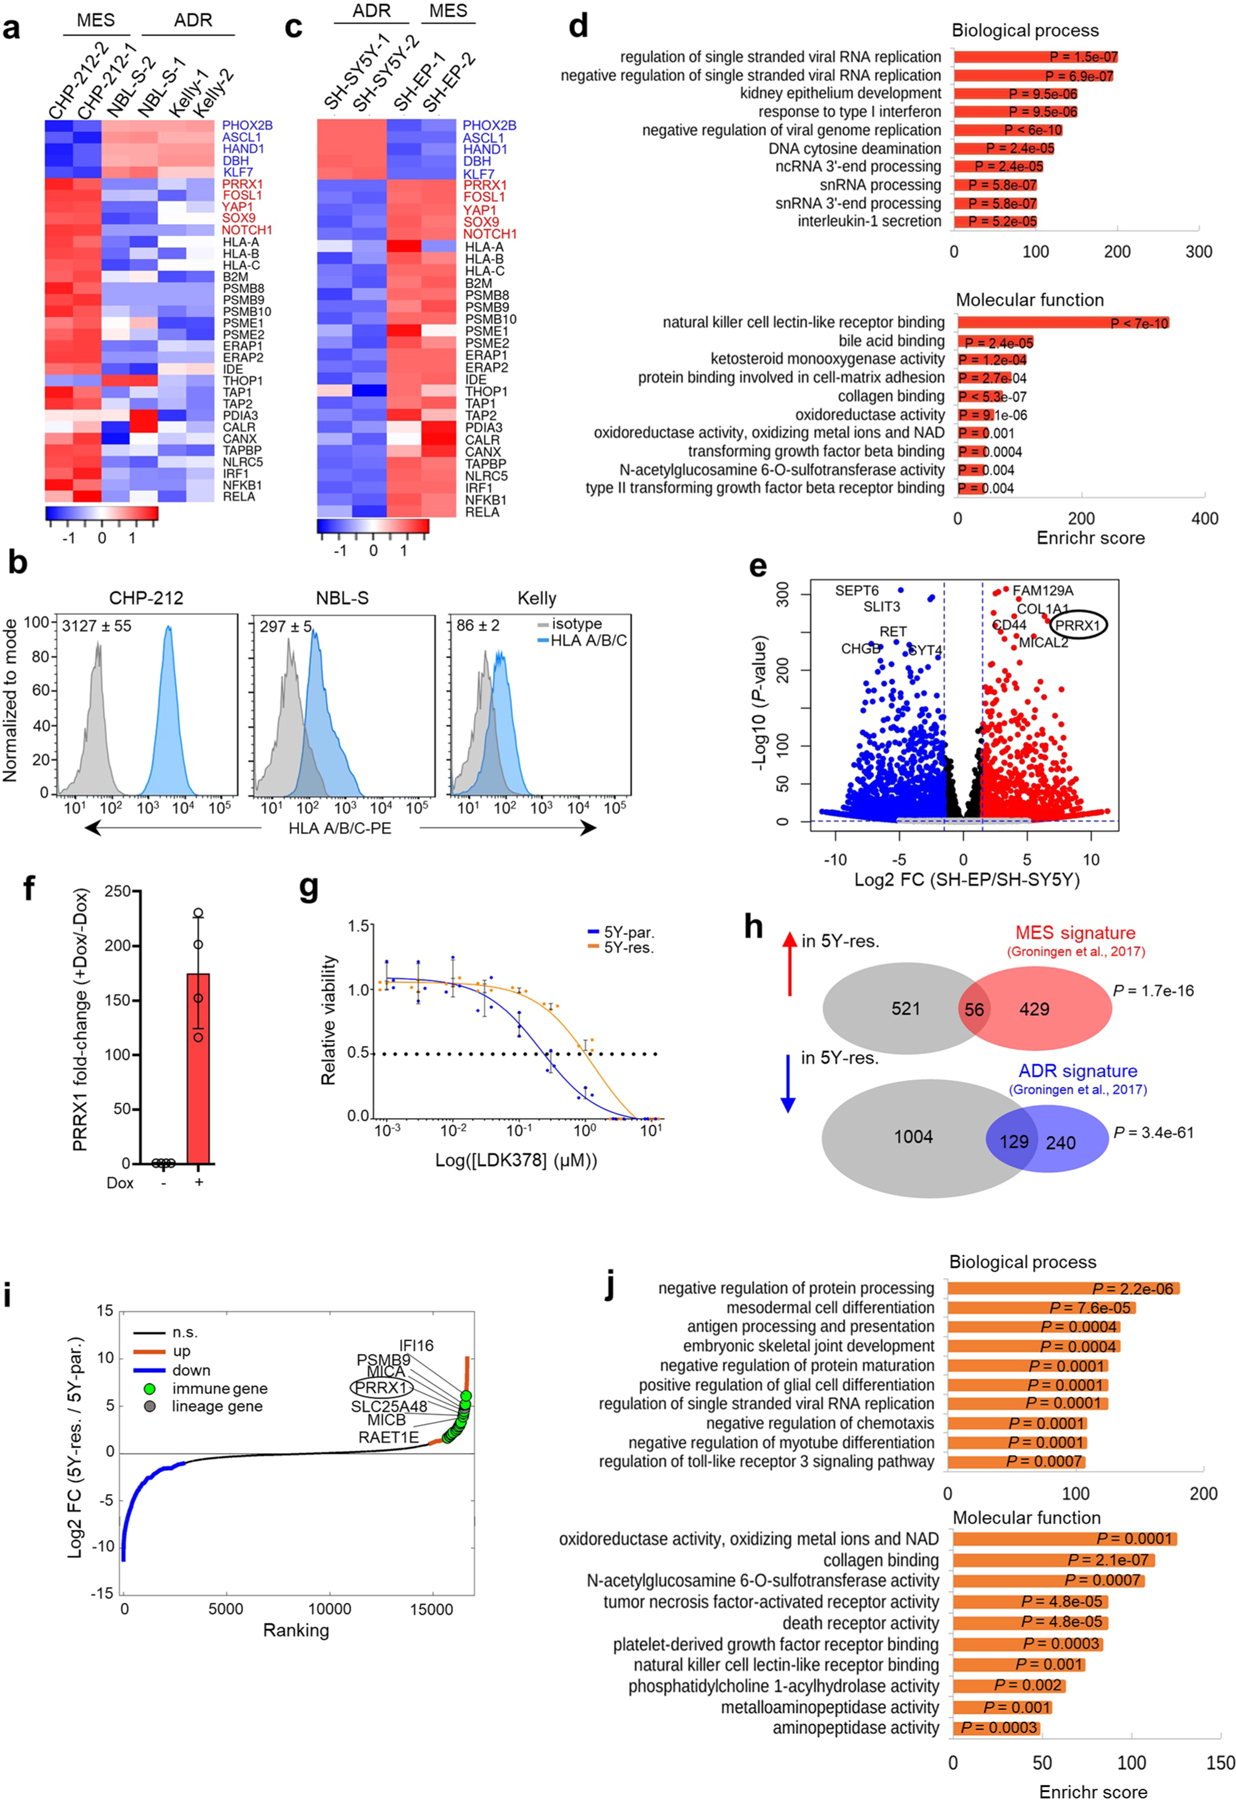
Extended Data Fig. 6 |. Tumor cell-intrinsic immune marker genes are upregulated in mesenchymal NBs.

a, Heat maps of lineage marker (blue, adrenergic; red, mesenchymal) and MHC and APM gene (black) expression in the indicated adrenergic and mesenchymal cells (n = 2 independent experiments). Rows are z-scores calculated for each transcript in each cell type. b, FACS analysis of cell surface HLA expression in the cells depicted in a. Numbers on bottom right indicate isotype-normalized HLA gMFI values expressed as mean ± SD, n = 3 independent experiments. c, Heat map of lineage marker (blue, adrenergic; red, mesenchymal), MHC and APM gene (black) expression in SH-SY5Y and SH-EP adrenergic and mesenchymal cells, respectively (n = 2 independent experiments). Rows are z-scores calculated for each transcript in each cell type. d, GO analysis of differentially upregulated genes in mesenchymal SH-EP and adrenergic SH-SY5Y cells. Significance determined by the Fisher’s exact test. e, Volcano plot showing the gene expression changes between mesenchymal SH-EP and adrenergic SH-SY5Y cells. The top ten lineage marker genes are highlighted. The fold changes are represented in log2 scale (X-axis) and the -log10 of the P-values depicted on Y-axis (FDR < 0.1 and log2FC > 1.5). Significance was determined by two-tailed Wald test. f, RT-qPCR analysis of PRRX1 expression in SH-SY5Y cells expressing dox-inducible PRRX1 ± dox for 10 days. Data represent mean ± SD, n = 4 independent experiments. g, Dose-response curves of ceritinib-sensitive (5Y-par.) and -resistant (5Y-res.) cells treated with increasing concentrations of LDK378 for 72 h. Data show mean ± SD, n = 3 technical replicates and is representative of n = 3 independent experiments. h, Venn diagrams depicting the overlap between the DEGs in 5Y-res. cells (compared to 5Y-par. cells) and mesenchymal or adrenergic signatures. P-values were determined by two-tailed Fisher’s exact test. i, Waterfall plot of the fold-change in RNA expression levels of up- and down-regulated genes in 5Y-res. cells compared to 5Y-par. cells; selected lineage and immune genes are highlighted. j, GO analysis of differentially upregulated genes in 5Y-res. compared to 5Y-par. cells. Significance determined by the two-tailed Fisher’s exact test.
