
Extended Data Fig. 7 |. NBs that acquire mesenchymal phenotypes at relapse show increased immune gene expression.
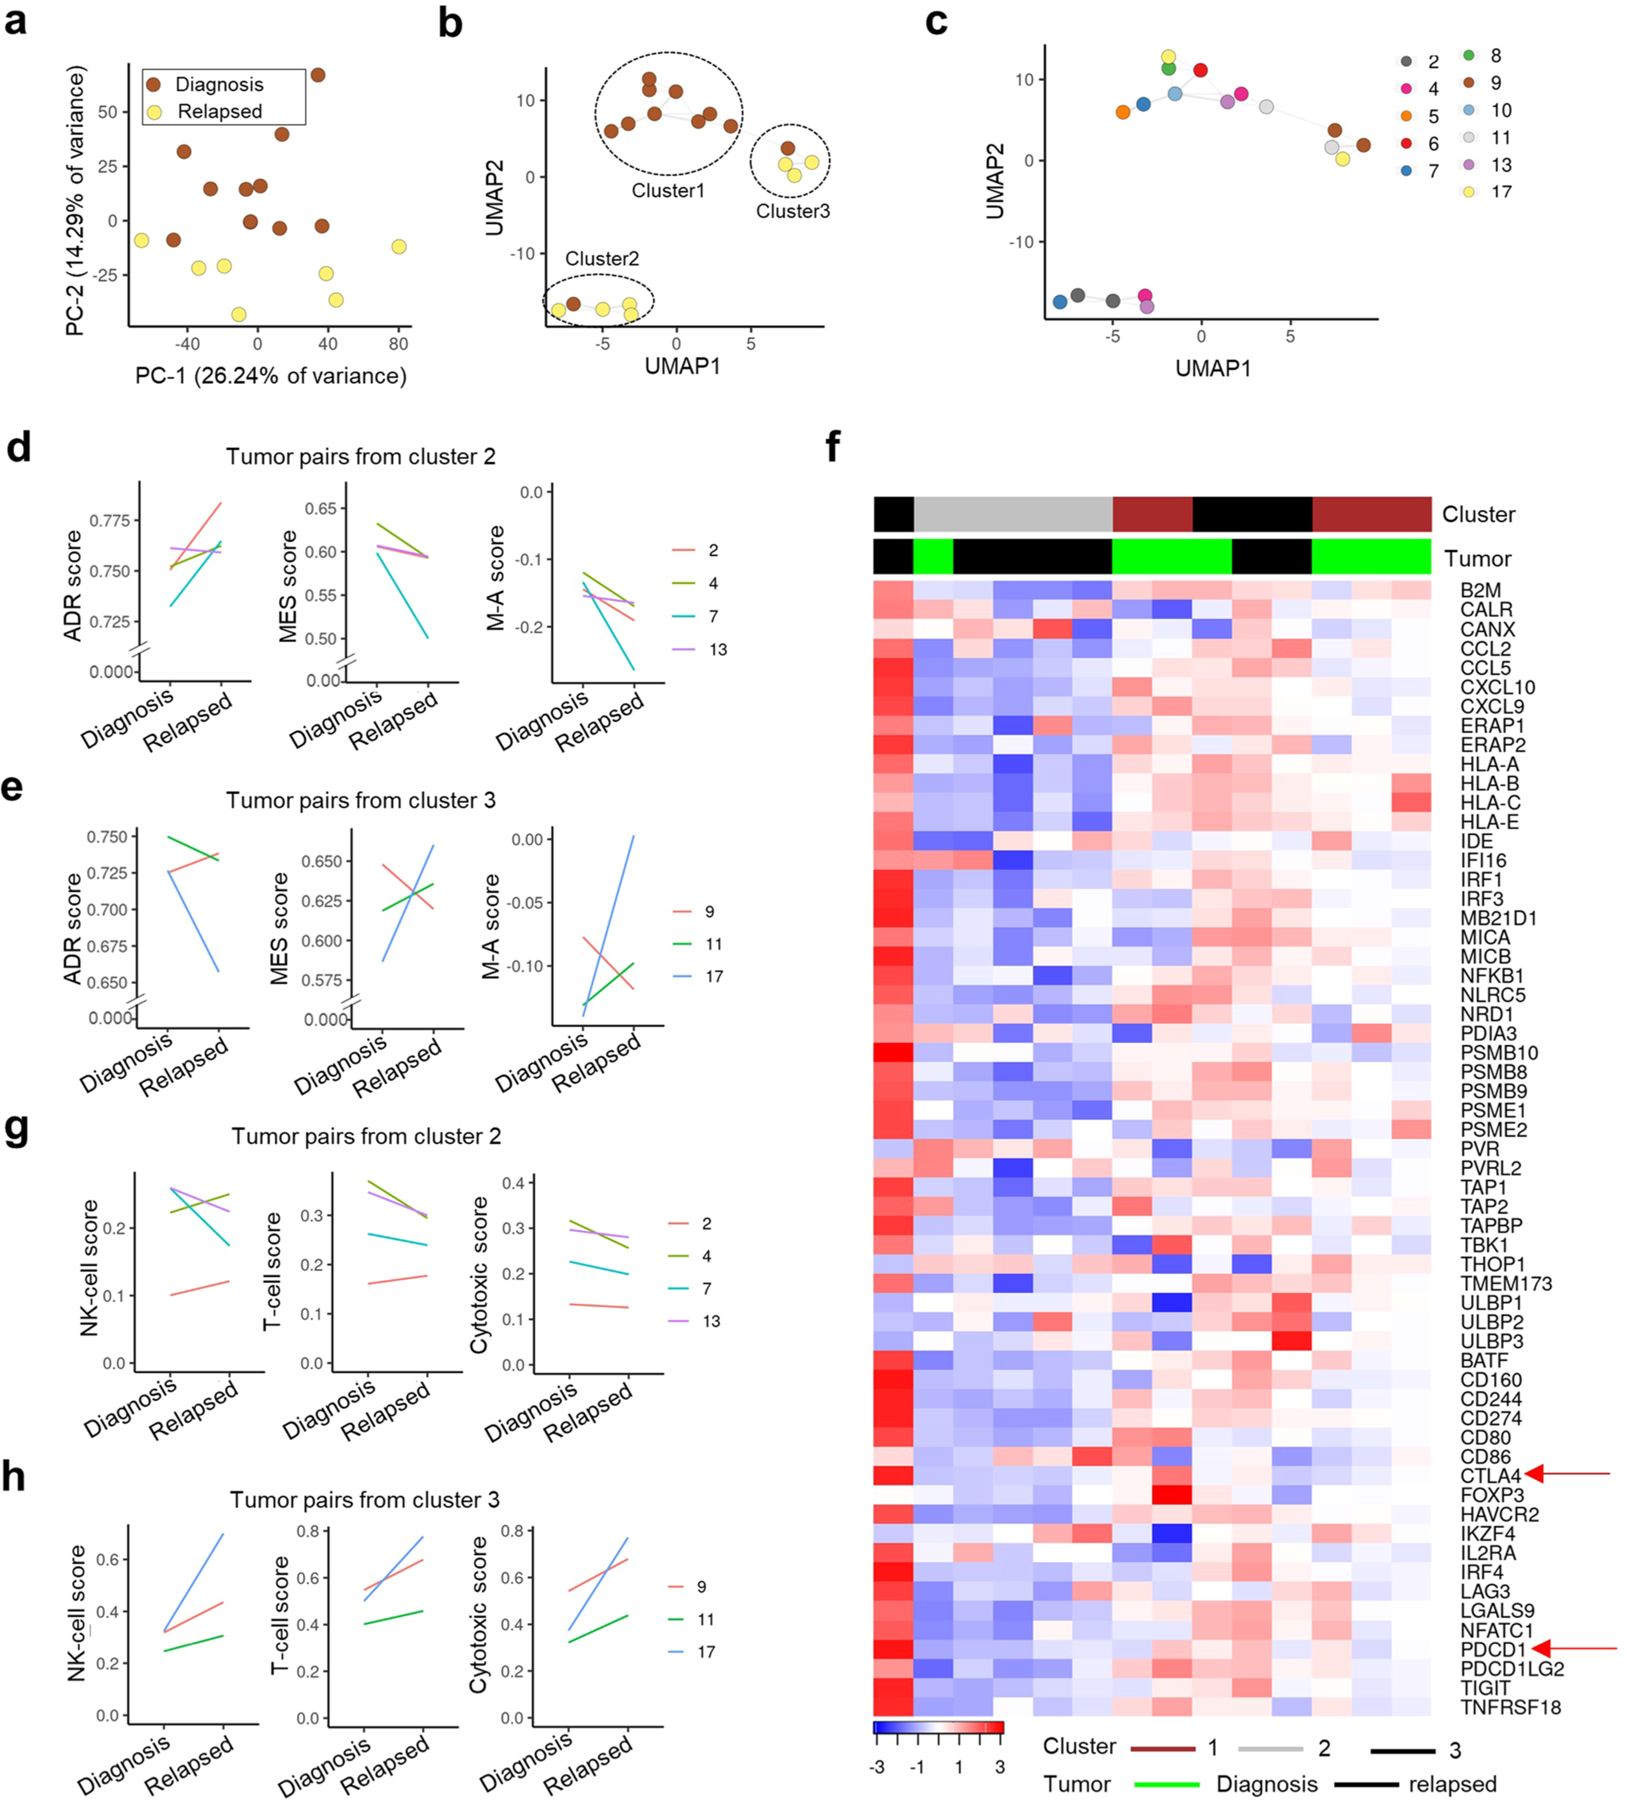
a, PCA plot showing the segregation of the depicted tumors using the 1st and 2nd PCs in 7 matched pairs and 4 single primary tumors. b, c, UMAP plot showing the segregation of primary and relapsed tumors (b) overlaid with the sample numbers (c). d, e, Line plots depicting changes in ADR, MES and M-A (MES-ADR) scores between primary and relapsed tumor pairs in clusters 2 (d) and 3 (e). f, Heat map of z-score-transformed log2 normalized expression values of tumor cell-intrinsic IA and IE genes in the 7 matched tumor pairs (n = 14 tumor samples). g, h, Line plots depicting the changes in the indicated immune cell scores in primary and relapsed tumor pairs in clusters 2 (g) and 3 (h).