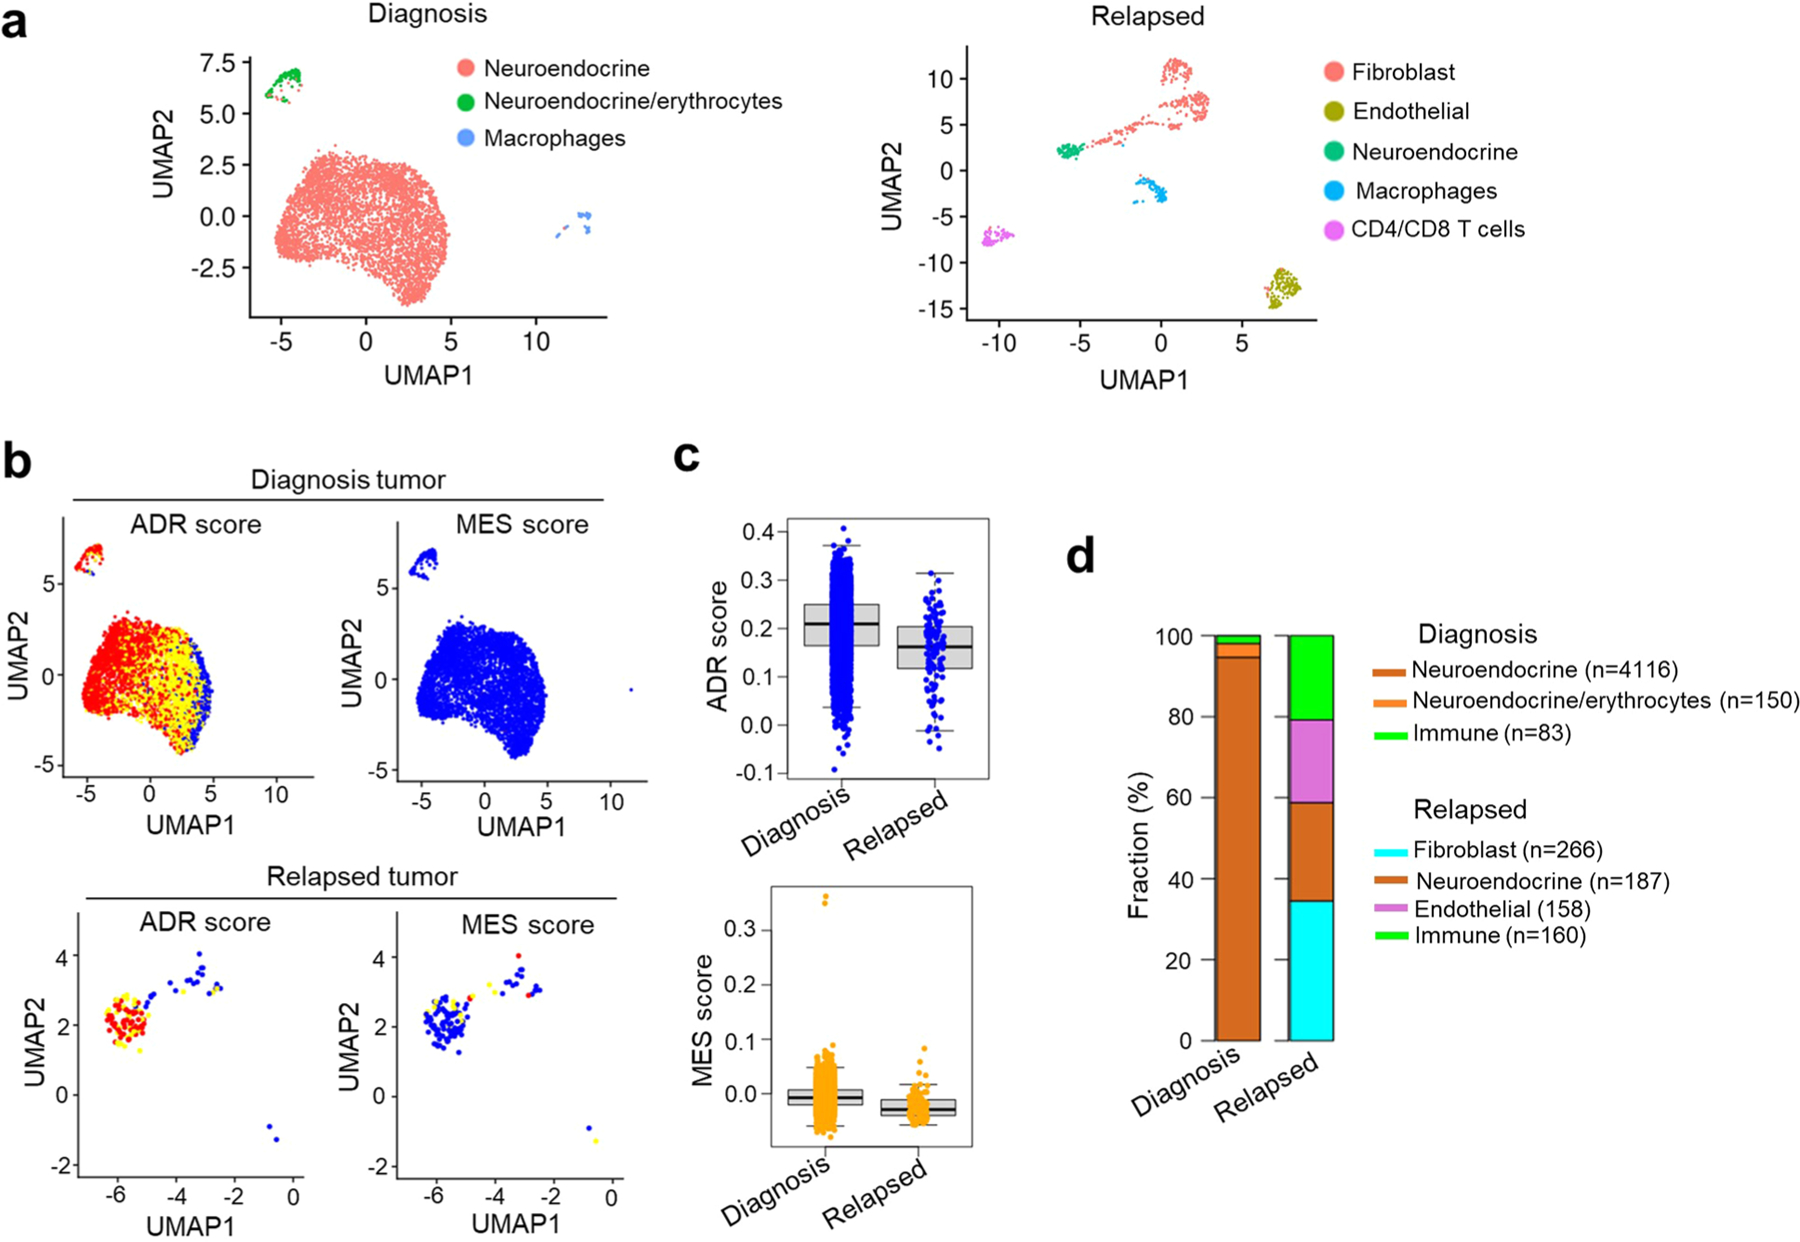
Extended Data Fig. 8 |. Enrichment of immune cells is seen at relapse in a matched diagnosis-relapsed NB tumor pair.

a, UMAP embedding of single cell profiles (dots) from diagnosis (left; n = 4349 cells) and relapsed (right; n = 771 cells) samples, colored by cell subset signatures. b, UMAP visualization of the distribution of ADR and MES scores of malignant cells at diagnosis (top; n = 4266 cells) and relapse (bottom; n = 113 cells). c, Box plot depicting the ADR (top) and MES (bottom) scores of the malignant cells in each sample [diagnosis (n = 4266), relapse (n = 113)]. Box plots are defined by center lines (medians), box limits (25th and 75th percentiles) and whiskers (minima and maxima; the smallest and largest data range). d, Bar plot representing the proportion of neuroendocrine cells (tumor), fibroblasts, endothelial cells and immune cells in each sample.
