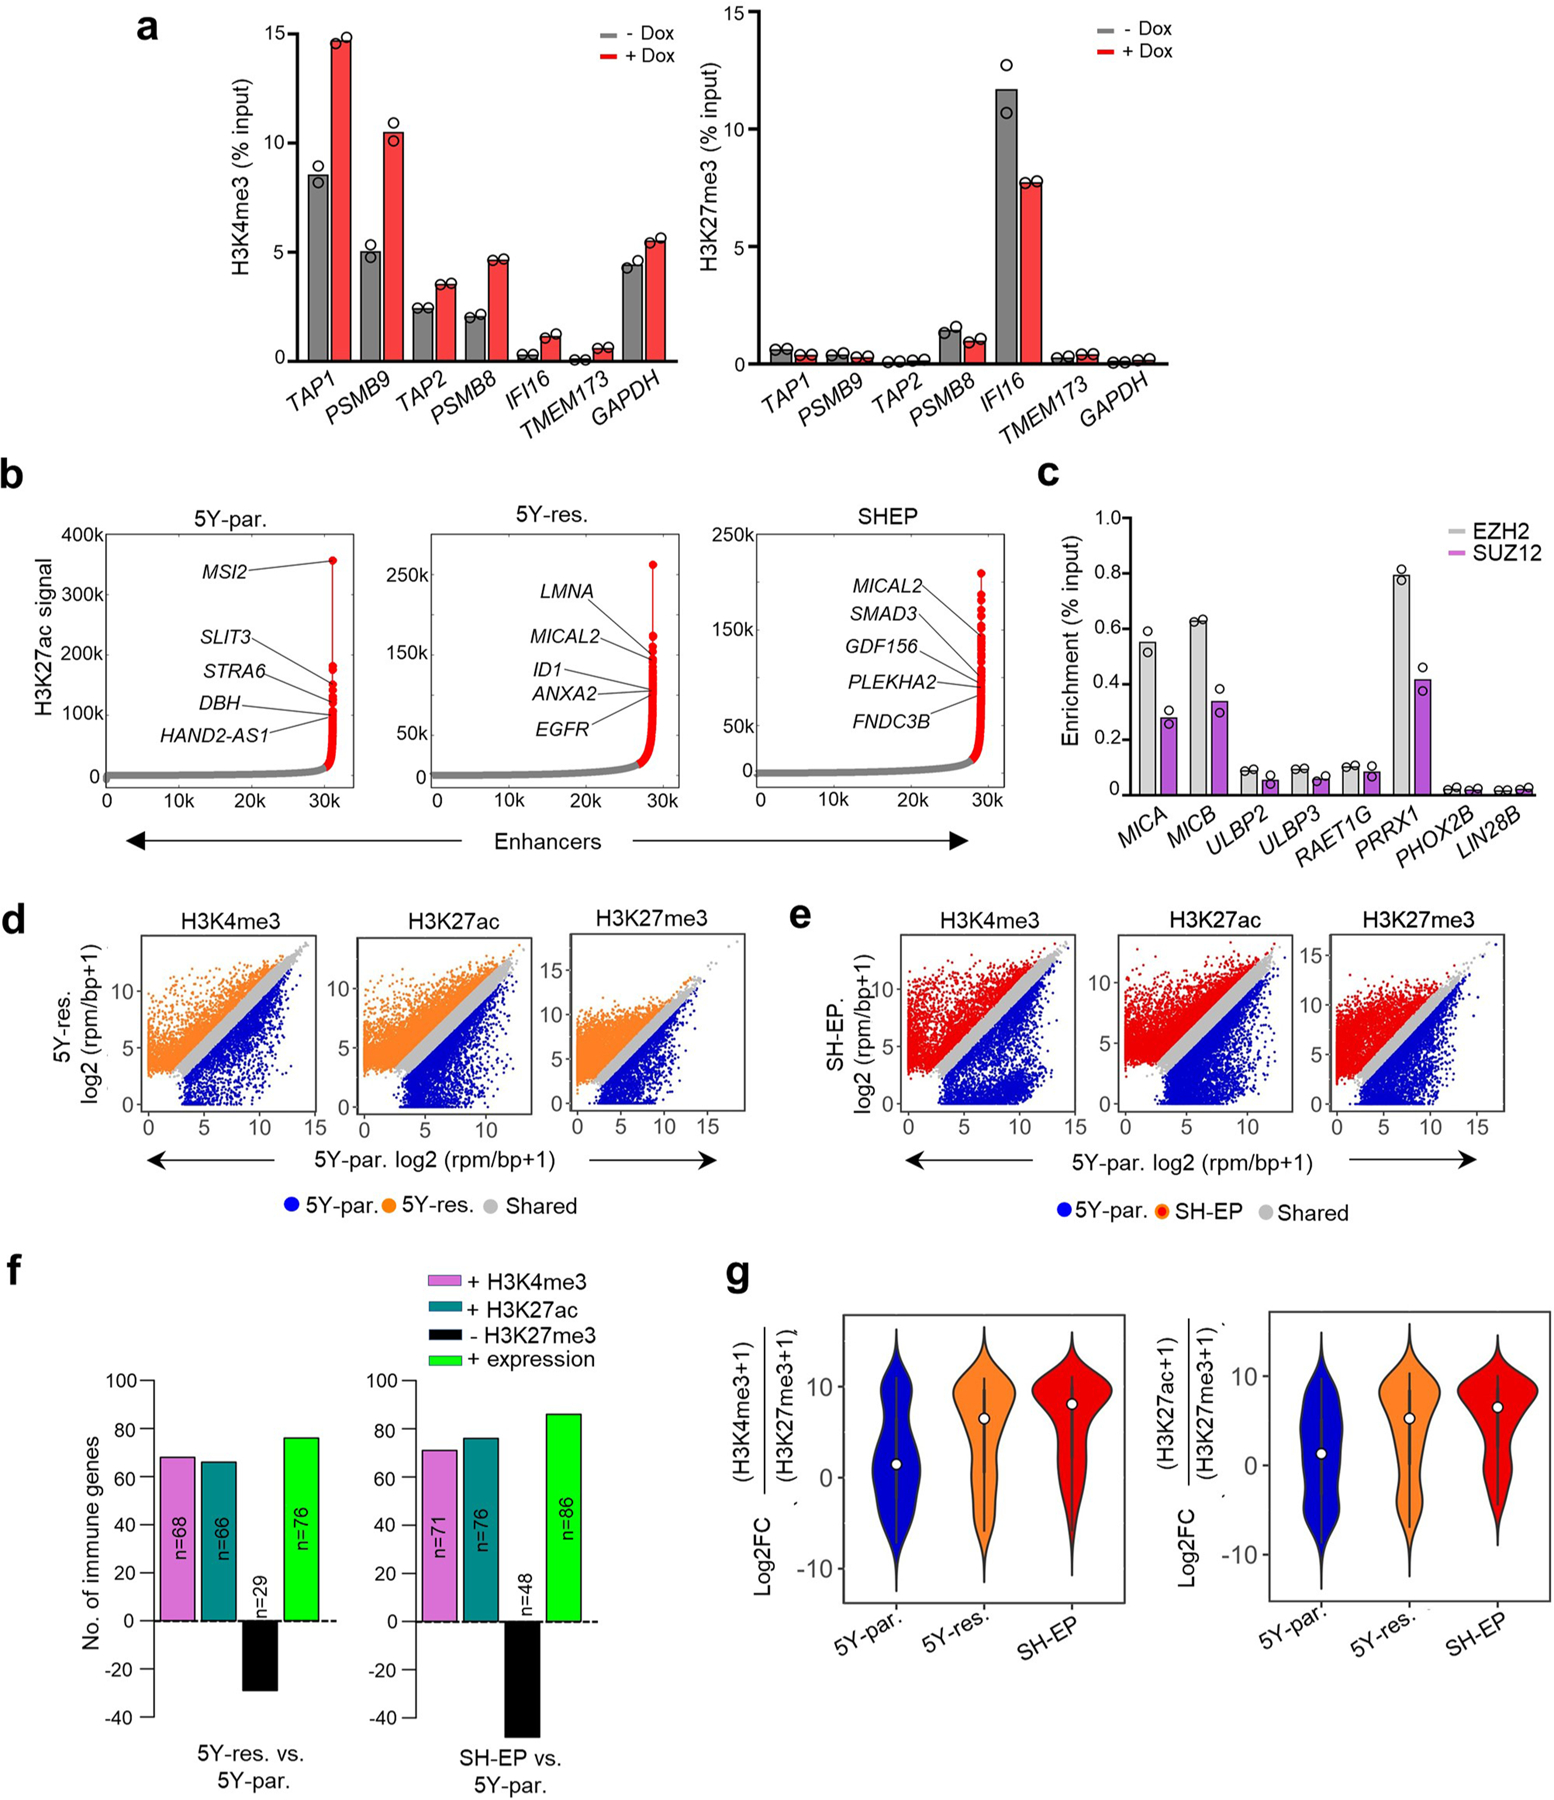
Extended Data Fig. 9 |. Immune gene activation associated with the mesenchymal state is epigenetically regulated.

a, ChIP-qPCR analysis of the indicated histone marks at the indicated immune gene promoters in SH-SY5Y cells expressing dox-inducible PRRX1 ± dox. Data points represent mean of 2 technical replicates of 2 independent experiments. Enrichments at TAP1 and PSMB9 loci represent the data corresponding to amplicons 4 and 6, respectively, in Fig. 4a. b, Enhancer regions in 5Y-par., 5Y-res. and SH-EP cells. H3K27ac bound regions identified as significant peaks were stitched together if they were within 12.5 kb of each other (typical enhancers; grey). SEs (red) were defined as stitched enhancers surpassing the threshold signal based on the inclination point in all cell types. In 5Y-par., 5Y-res. and SH-EP cells, 2.94% (915/31116), 6.56% (1880/28635) and 4.18% (1215/29057) of the enhancers were classified as SEs, respectively. The top five SE-associated lineage-specific genes are highlighted. c, ChIP-qPCR analysis of EZH2 and SUZ12 enrichment at the indicated immune genes in 5Y-par. cells. Negative control loci, PHOX2B and LIN28B. Data represent mean of n = 2 independent experiments. d, e, Scatter plots representing the differential binding of the indicated histone marks at the promoter regions of all protein coding genes between 5Y-par and 5Y-res. (d), and 5Y-par. and SH-EP cells (e). rpm/bp, reads per million per base pair. A ≥ 0.75 log2FC threshold was used to identify unique peaks for each histone mark. f, Bar plots representing the numbers of immune genes with increased promoter deposition of H3K4me3 and H3K27ac (log2 FC ≥ 0.75) and loss of H3K27me3 (log2 FC ≥ 0.75) marks, together with increased RNA expression (log2 FC ≥ 1) in 5Y-res. (left) or SH-EP (right) compared to 5Y-par. cells. g, Violin plots of the ratios of active to repressive histone marks surrounding immune gene promoters in the indicated cells. Significance determined by the two-tailed Wilcoxon rank-sum test. Box plots within the violin plots defined by center lines (medians), box limits (25th and 75th percentiles) and whiskers (minima and maxima; 1.5X the interquartile range).
