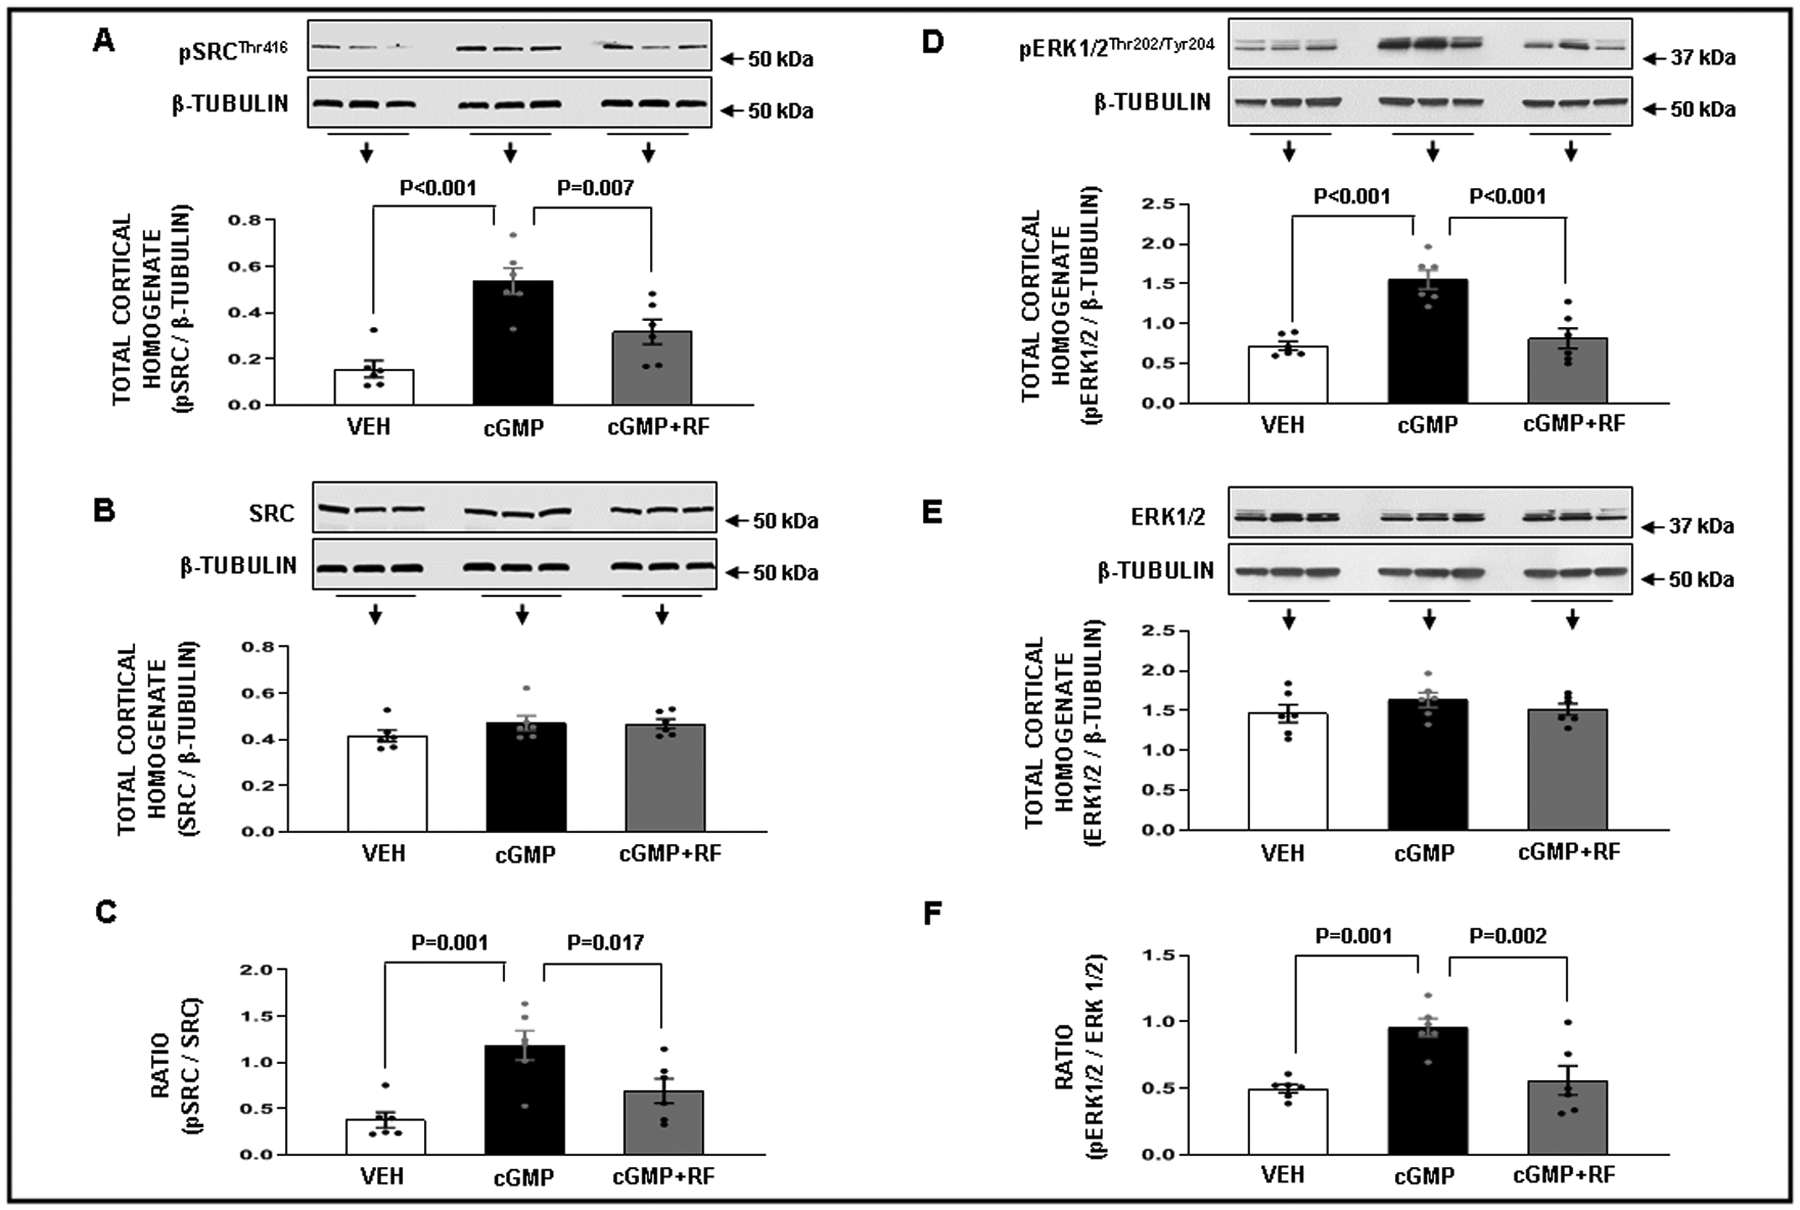
Figure 2.

Panel A. Western blot analysis of total cortical homogenate phospho-SrcThr416 (pSrcThr416) protein levels in response to the following conditions: ( ) Time Control Vehicle (VEH; N=6): rats received renal interstitial (RI) infusion of VEH D5W for 2h. (
 ) cGMP (N=6): rats received RI infusion of VEH for 30 min during the control period followed by cumulative RI infusions of cGMP (18, 36, and 72 μg/kg/min; each dose for 30 min) during the experimental periods. (
 ) cGMP + Rostafuroxin (RF) (N=6): rats received RI infusion of VEH for 30 min during the control period followed by the RI co-infusion of cGMP + RF (12 ng/kg/min) during the experimental periods. Panel B. Western blot analysis of total Src protein levels in response to the conditions in Panel A. Panel C. Ratio of (pSrcThr416 / β-Tubulin) / (total Src / β-Tubulin) in response to the conditions in Panel A. Panel D. Western blot analysis of phospho- Erk1/2Thr202/Tyr204 (pErk 1/2 Thr202/Tyr204) protein levels in response to the conditions in Panel A. Panel E. Western blot analysis of total Erk protein levels in response to the conditions in Panel A. Panel F. Ratio of (pErk 1/2 Thr202/Tyr204 / β-Tubulin) / (total Erk 1/2 / β-Tubulin) in response to the conditions in Panel A. Data represent mean ± 1 SE. Statistical significance was determined by using the repeated measures analysis with an unstructured covariance matrix in SAS PROC MIXED program. The ANOVA with permutation P value was based on 10,000 permutations of group assignment to individual N values and a repeated measures analysis with an unstructured covariance matrix.
