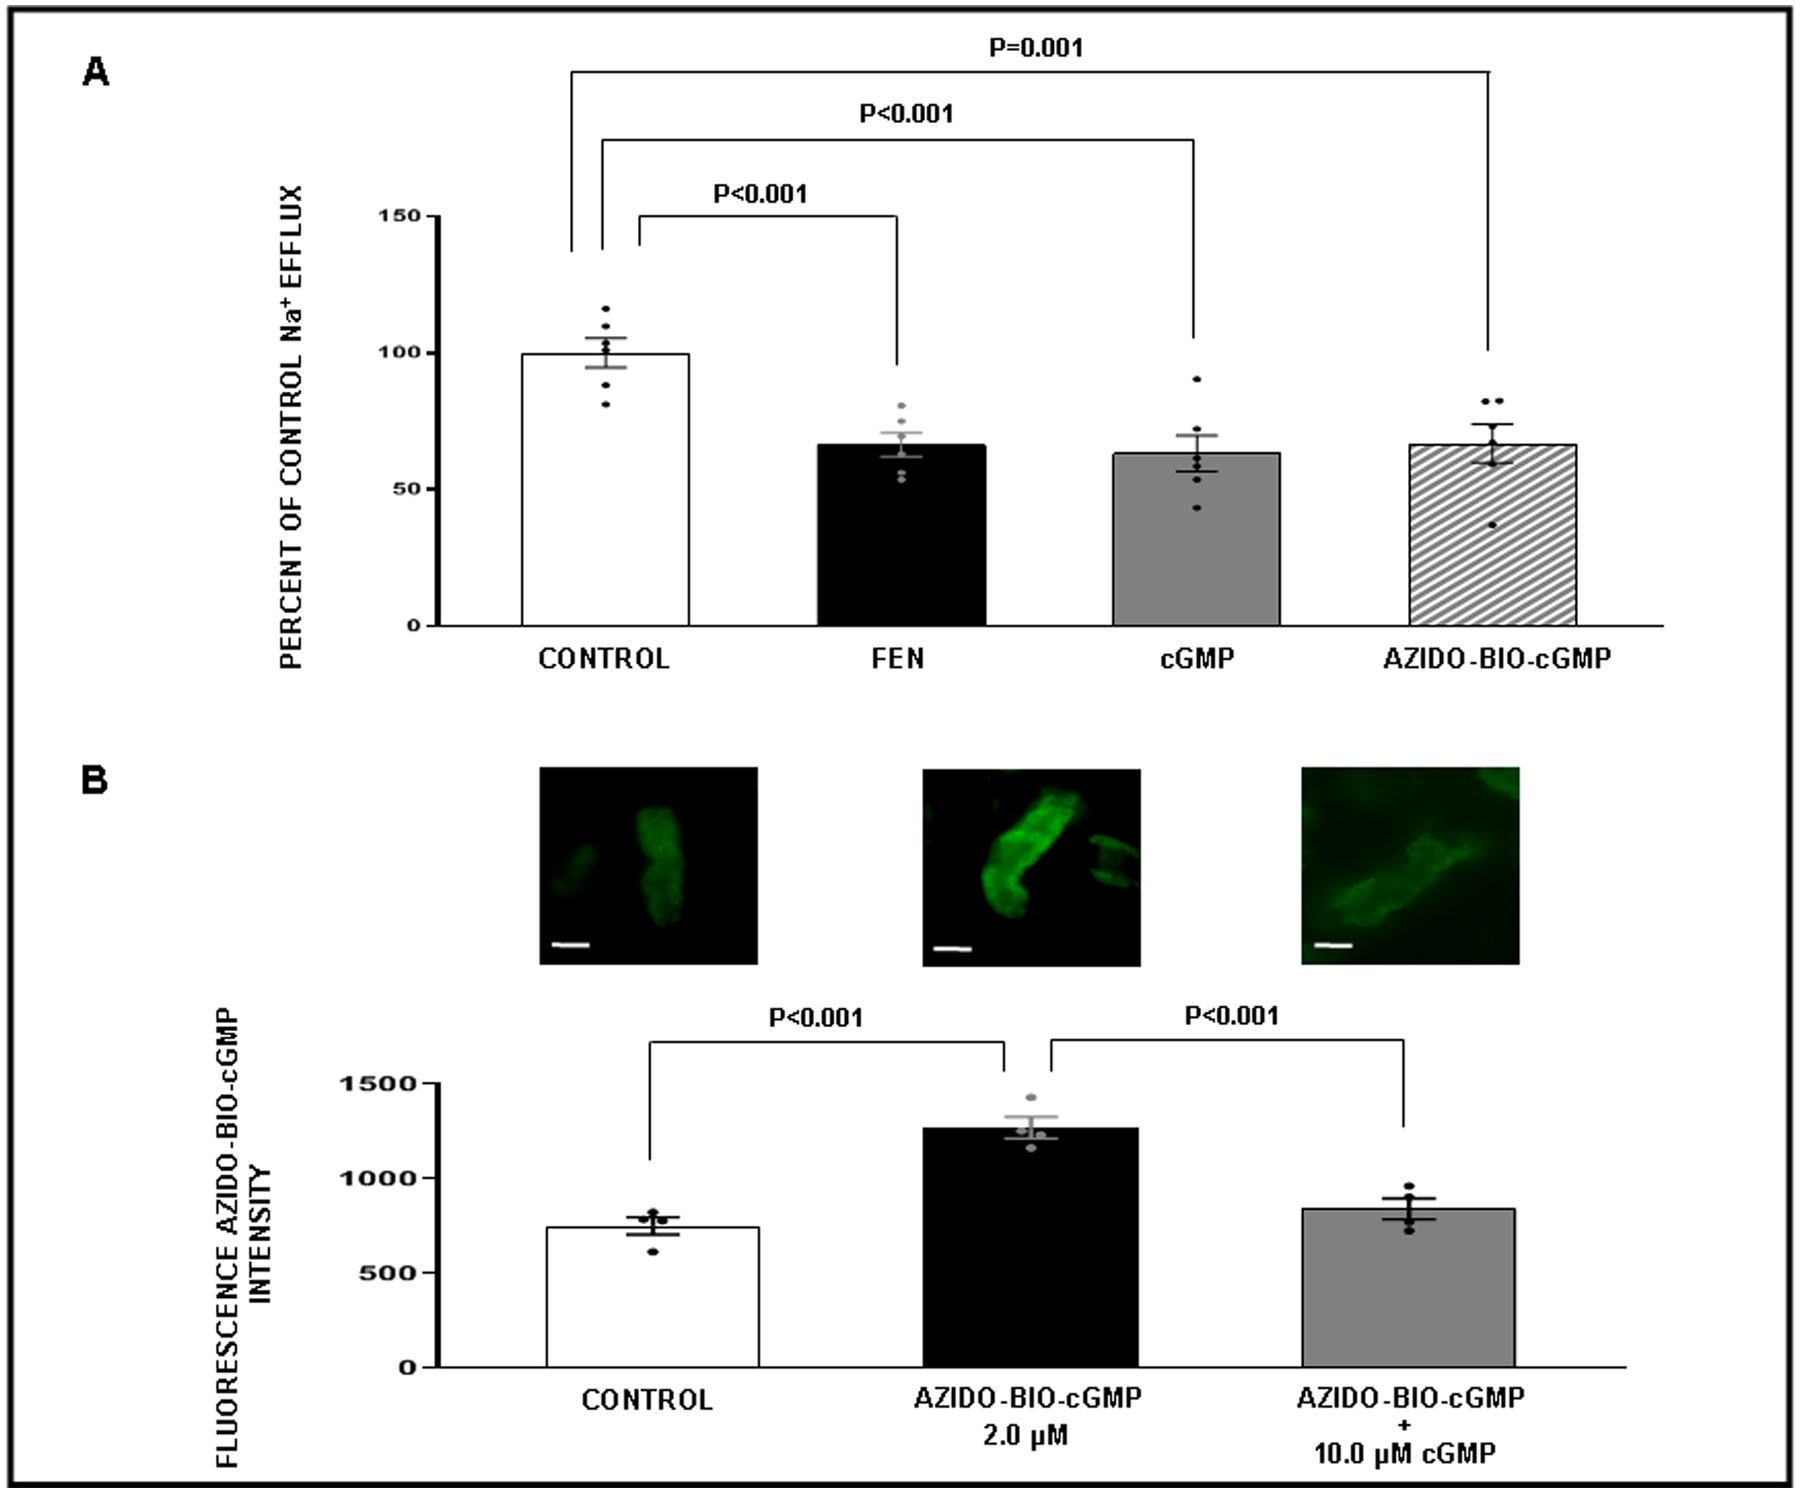
Figure 3.

Panel A. Sodium (Na+) efflux assay in WKY renal proximal tubule (RPT) cells in response to the following conditions. ( ) Control: Opti-MEM. (
 ) Fenoldopam (FEN): 1 μM. (
 ) cGMP: 2 μM. (
 ) Azido-biotinylated-cGMP (Azido-BIO-cGMP): 2 μM. For each condition measurements were taken from 6 separate wells in a 96-well plate with 20 locations measured per well. Results are presented as a percent of control Na+ efflux. Panel B. Competitive binding confocal microscopy experiments with RPTs isolated from normal rats (N=4 for each experiment). The experiment was repeated 4 separate times using new fresh kidneys every time. Within each experiment, for each condition, measurements from 3 separate wells in a 96-well plate were averaged. Effects of cGMP on Azido-BIO-cGMP binding. (
 ) Control: Opti-MEM. (
 ) Azido-BIO-cGMP: 2 μM. (
 ) Azido-BIO-cGMP + cGMP: (10 μM). Control fluorescence values represent background. All other results are reported as Azido-BIO-cGMP fluorescence intensity above background. Data represent mean ± 1 SE. Scale bars represent 10 μm. Statistical significance was determined by using the repeated measures analysis with an unstructured covariance matrix in SAS PROC MIXED program. The ANOVA with permutation P value was based on 2,000 permutations of group assignment to individual N values and a repeated measures analysis with an unstructured covariance matrix.
