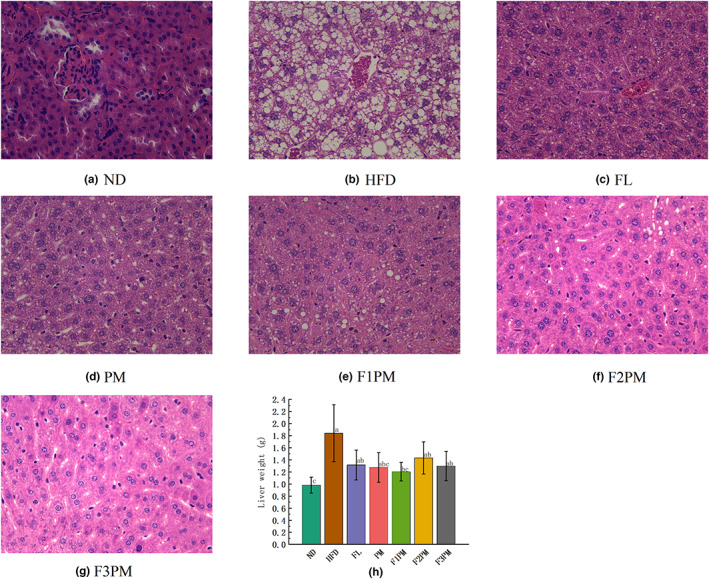
FIGURE 3.

Liver weight and morphological structure of the liver tissue. (a) HE staining of liver tissue in ND group; (b) HE staining of liver tissue in HFD group; (c) HE staining of liver tissue in FL group; (d) HE staining of liver tissue in PM group; (e) HE staining of liver tissue in F1PM group; (f) HE staining of liver tissue in F2PM group. (g) HE staining of liver tissue in F3PM group; (h) Liver weight. Data are means ± SD (n = 12). Different lower case letters above columns indicate statistical differences at p < .05.
