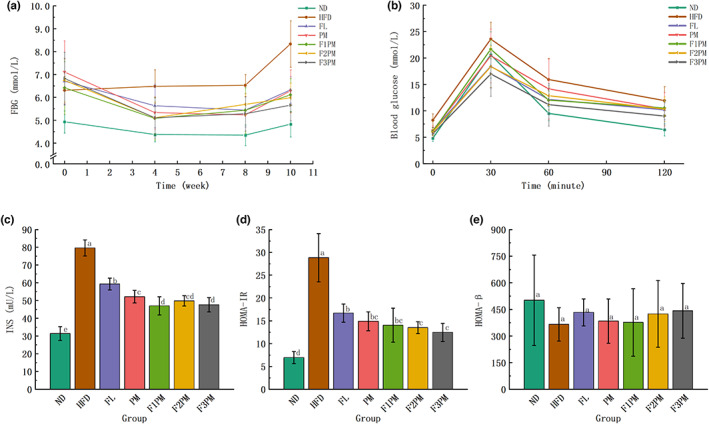
FIGURE 5.

Results of markers of glucose metabolism. (a) Fasting blood glucose; (b) OGTT (Oral glucose tolerance tests); (c) Serum INS (insulin) level. (d) HOMA‐IR (insulin resistance index); (e) HOMA‐β(insulin β‐cell function); Data are means ± SD (n = 12); Groups that do not share the same letter are significantly (p < .05) different from each other.
