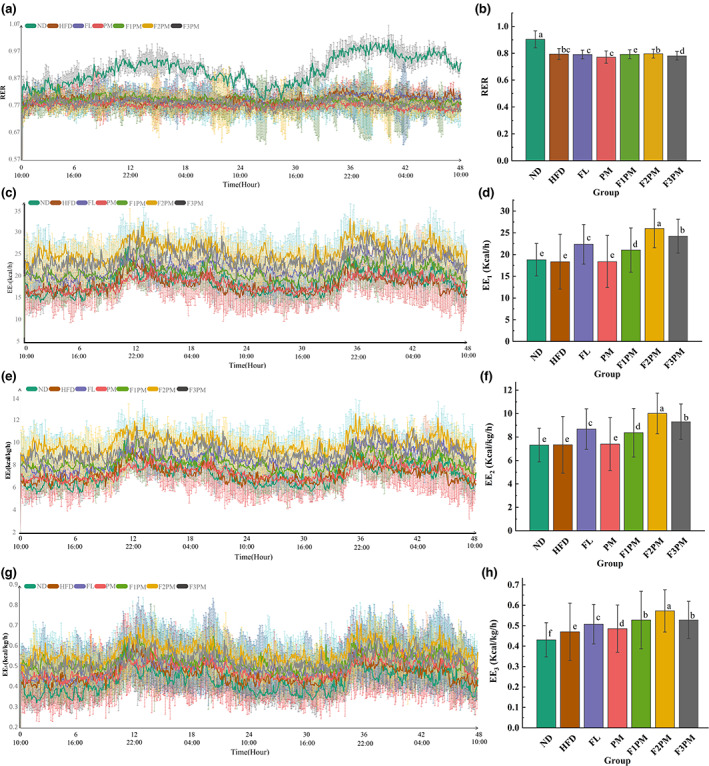
FIGURE 6.

Energy metabolism‐related indicators. (a) Change in the respiratory exchange ratio (RER) over time; (b) Comparison of the mean RER of each group; (c) Change in the energy expenditure (EE1) over time; (d) Comparison of the mean EE1 of each group; (e) Change in the energy expenditure (EE2) over time; (f) Comparison of the mean EE2 of each group; (g) Change in the energy expenditure (EE3) over time; (h) Comparison of the mean EE3 of each group; The body weight was used to correct EE1 to obtain EE2, and the lean body mass was used to correct EE2 to obtain EE3. Data are means ± SD (n = 12); Groups that do not share the same letter are significantly (p < .05) different from each other.
